
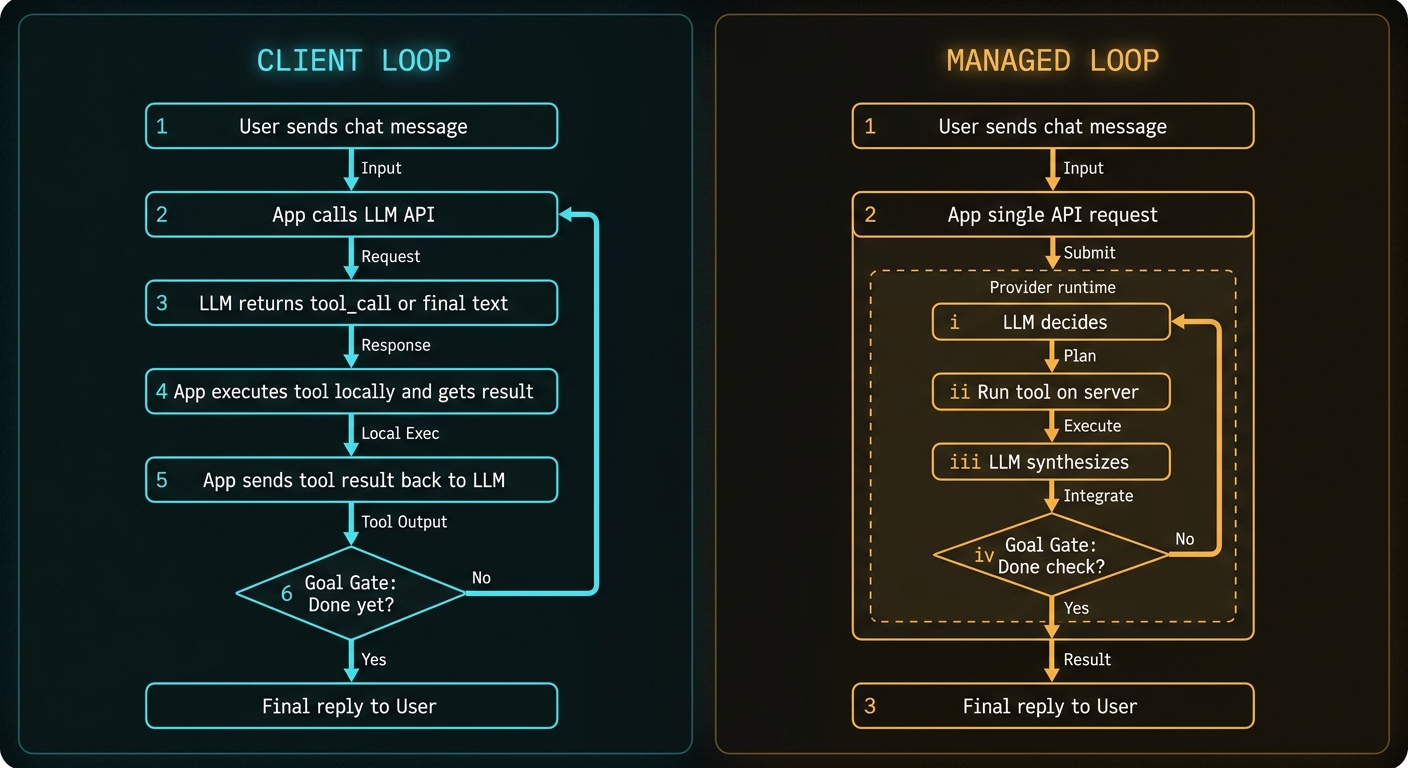
Models plan; code executes. The loop is non-negotiable: propose an action, run it, feed the result back, repeat until done. What is negotiable is where the loop runs – in your service, or inside the inference provider’s runtime behind a single API call.
The Goal Gate
Both patterns share one thing: a rule that says “we are done.” Without it the agent loops forever. In code it looks like this:
// Three ways to terminate a loop:

// 1. Model returned a final answer (no tool calls requested)
if (!res.tool_calls?.length) return res.content;

// 2. Hard step budget - never let open-ended tasks burn silently
if (step >= MAX_STEPS) throw new Error("step budget exceeded");

// 3. Judge call - a rules check or small classifier says the
//    original question is satisfied even if the model wants more
if (await judge.isSatisfied(originalQuery, accumulatedAnswer)) return;
Local and managed loops differ in who runs that gate – your for loop or the provider runtime – not in whether it exists.
Local Loop: Your Code Owns Every Hop
Example: “What’s the status of order 8842?”
// ── HOP 1: send user message to model ──────────────────────────────
const hop1 = await llm.chat({
  messages: [
    { role: "system", content: "Use lookup_order when needed." },
    { role: "user",   content: "What's the status of order 8842?" }
  ],
  tools: [lookupOrderSchema]
});
// Model does NOT answer yet - it requests a tool:
// { content: null, tool_calls: [{ name: "lookup_order", arguments: { order_id: "8842" } }] }

// ── YOUR CODE RUNS THE TOOL (not the LLM) ──────────────────────────
const result = await db.query(
  "SELECT status, carrier, eta FROM orders WHERE id = $1",
  ["8842"]
);
// { status: "shipped", carrier: "DHL", eta: "2026-06-26" }

// ── HOP 2: feed the result back, get the final answer ──────────────
const hop2 = await llm.chat({
  messages: [
    ...previousMessages,
    { role: "tool", tool_call_id: hop1.tool_calls[0].id,
      content: JSON.stringify(result) }
  ],
  tools: [lookupOrderSchema]
});
// { content: "Order 8842 shipped via DHL, arrives 26 June.", tool_calls: [] }

// ── GOAL GATE: tool_calls empty -> exit loop, send reply to user ───
One user turn. Two LLM round-trips. One DB query. Log all three latency contributions separately – never lump them into a single “response time” figure.
Example: Multi-tool research (three hops, one visible reply)
User: Compare our refund policy with what competitor X published last month.Two messages in the chat UI. Three internal hops:
- Model requests
fetch_url(competitorPricingURL). Your scraper runs and returns markdown. - Model requests
search_knowledge_base("refund policy"). Your vector DB returns a chunk. - Model synthesises both results. No further tool calls. Goal gate opens.
// Each hop gets its own metric - this is what tells you which one is slow:
metrics.record("llm_hop1_ms",    hop1ElapsedMs);
metrics.record("tool_fetch_url_ms", fetchElapsedMs);
metrics.record("tool_search_kb_ms", searchElapsedMs);
metrics.record("llm_hop2_ms",    hop2ElapsedMs);
The full local runner
async function runAgent(messages, tools, maxSteps = 8) {
  for (let step = 0; step < maxSteps; step++) {
    const res = await llm.chat({ messages, tools });

    // Goal gate: model returned a final answer.
    if (!res.tool_calls?.length) return res.content;

    // Execute every requested tool locally, append results to context.
    for (const call of res.tool_calls) {
      const out = await executeLocally(call);  // your code, your network, your logs
      messages.push({ role: "tool", tool_call_id: call.id,
                      content: JSON.stringify(out) });
    }
  }
  // Goal gate never triggered inside the step budget.
  throw new Error("max steps reached");
}
Managed Loop: Provider Runs the Inner Cycle
Same logical loop, but the provider runs it. Your application sends one request; the provider calls the model, dispatches tools, feeds results back, and returns only when its internal goal gate fires.
Example: "What's the status of order 8842?" (managed)
// ── YOUR APPLICATION: one call ─────────────────────────────────────
const res = await llm.chat({
  messages: [
    { role: "system", content: "You help with orders." },
    { role: "user",   content: "What's the status of order 8842?" }
  ],
  tools: [{
    type: "mcp",
    server_url: "https://tools.example.com/mcp",  // must be publicly reachable
    allowed_tools: ["lookup_order"]
  }]
});
// Your code blocks here. Provider is running the loop internally.
// res.content == "Order 8842 shipped via DHL, arrives 26 June."

// ── WHAT HAPPENED INSIDE (only visible if you enable tracing) ──────
// [1] Model: tool_call lookup_order("8842")
// [2] Provider: connects to MCP server, runs tool, gets JSON
// [3] Model: synthesises final reply
// [4] Goal gate: no further tool calls -> return to client
Same reply. Different accountability surface. Your MCP server must be publicly reachable from provider egress IPs. Empty tool results never pass through your code, so handle them with a system-prompt rule:
// Add to system prompt for any managed-tool agent:
"If a tool returns no data or an error, say so explicitly.
 Do not infer or invent the answer."
Example: Web search agent (managed, serial tools)
// Your app:
const res = await llm.chat({
  messages: [{ role: "user",
    content: "Summarise Kubernetes networking changes in the last six months." }],
  tools: [{ type: "web_search", max_uses: 4 }]
});
// Provider internally: search -> search -> fetch -> synthesise
// User sees one reply after 3-8 seconds.
// Your logs show one API call. Provider traces show four hops.
Side-by-Side: Same Chat, Different Plumbing
| Question | Local loop | Managed loop |
|---|---|---|
| Who calls the LLM? | Your app, once per hop | Provider runtime, inside one request |
| Who runs tools? | Your process / MCP client | Provider runtime / remote MCP server |
| Who implements the goal gate? | Your loop + max_steps | Provider runtime limits |
| Debugging surface | Your logs and breakpoints | Provider trace API |
| User sees | One reply | One reply |
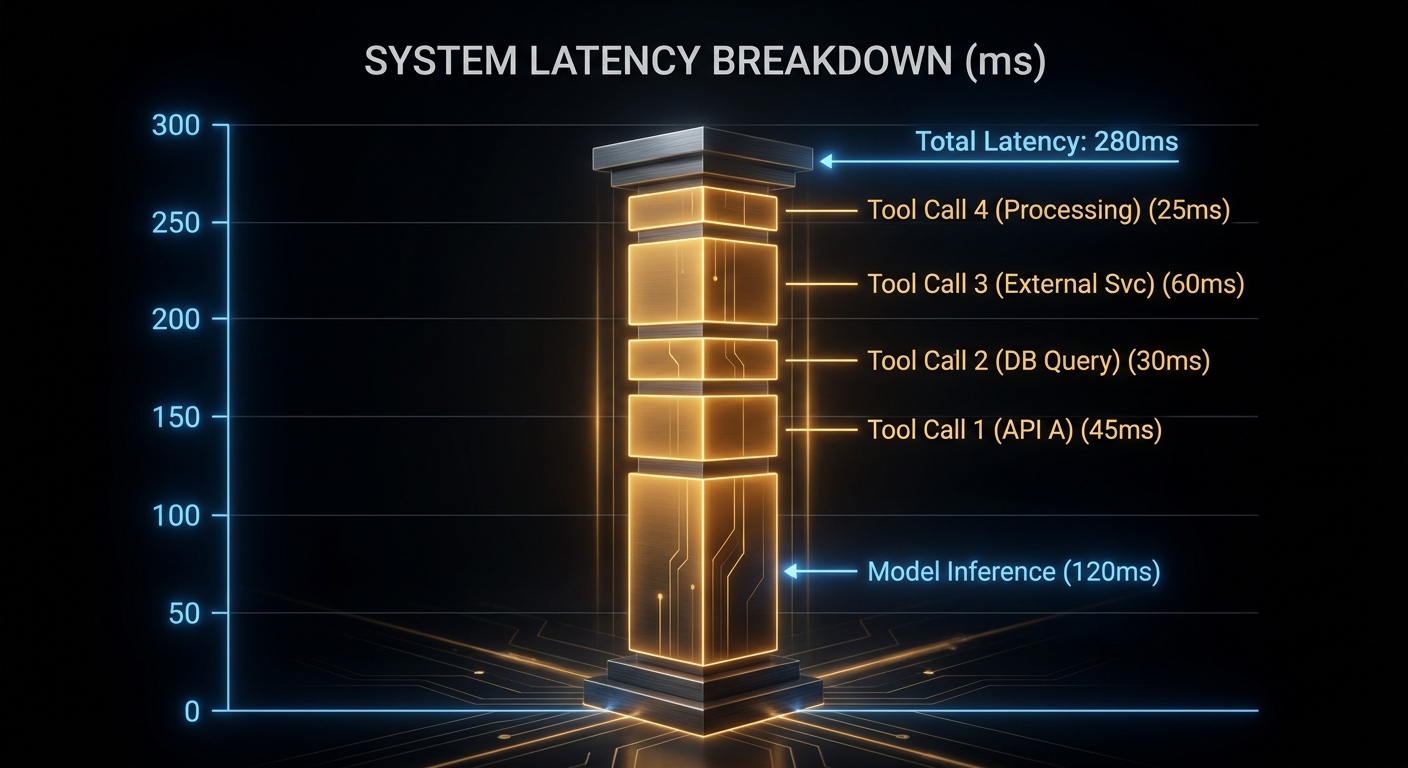
Latency: Count Every Hidden Hop
// Case 1: local tool cost ranges
// - in-process lookup:       < 1 ms
// - local MCP over stdio:    ~1 ms (warm process)
// - remote HTTP API:         50-300+ ms
// - cold MCP server boot:    seconds on first request

// Case 2: managed loop budget check - do this before committing
const budgetMs     = 800;   // acceptable TTFT for chat UX
const modelMs      = 350;   // per inner LLM call
const innerLlmCalls = 2;    // typical for one tool use
const toolMs       = 280;   // per tool round-trip

const totalMs = modelMs * innerLlmCalls + toolMs;
// 980ms - over budget.
// Fix: keep latency-sensitive tools local, parallelise, or reduce max_uses.

// Case 3: silent failure guard (managed mode)
// Model receives an empty tool result and may hallucinate a confident answer.
// There is no if/catch in your code path - the model is your only filter.
// System prompt rule is the guard:
"If any tool returns empty or an error, say so. Do not invent an answer."
Failures You Still Own in Managed Mode
// WRITE IDEMPOTENCY
// Read tools retry cleanly. Write tools need dedup keys:
const orderPayload = {
  idempotency_key: crypto.randomUUID(),  // provider may retry internally
  ...orderData
};

// NETWORK REACHABILITY
// Tools on private networks cannot move to managed without a proxy.
// Test before cutover:
curl -I https://tools.example.com/mcp  // must respond from provider egress IPs

// ALERT GRANULARITY - split these, they have different fixes:
// - provider_latency_p95
// - mcp_cold_start_ms
// - model_quality_degradation (separate alert, separate runbook)
When to Stay Local
- During development - you need per-hop logs and breakpoints at the tool boundary.
- Sub-second chat or voice UX where managed overhead is user-visible.
- Tools on private networks or requiring local session state.
- Custom goal gates: compliance judges, human-in-the-loop approval, or termination logic the provider runtime cannot implement.
When Managed Makes Sense
- Standard search and retrieval where you do not want to run your own search infrastructure.
- Many separate agents sharing one MCP tool surface.
- Tool credentials that should not live in application repositories.
- Teams that prefer paying with a tracing subscription rather than maintaining a loop runner.
Migration Path
- Build local first. Log tool name, argument size, latency, result size per hop from day one.
- Classify tools: read vs write, local vs remote, latency-sensitive vs batch-tolerant.
- Move read-only, tolerant tools to managed first. Keep write tools local until idempotency keys and retry semantics are confirmed.
- Enable provider tracing before cutover and compare inner-hop counts against your local logs. Divergence means something changed.
Swarms to Keep an Eye On
This covers the single-agent loop: one context window, serial hops. When tasks decompose into parallel research lanes, or you need orchestrator-worker topologies and peer handoffs, you are in multi-agent territory with different cost structures and failure modes. For the full evolution map - single-shot LLM through ReAct loop, agent stack, orchestrator swarms, and a 2026 watchlist - read the companion piece:
From Chat Completion to Agent Swarms: How Loop Architecture Evolved
What to Check Right Now
- Draw your loop on paper with numbered hops and the goal gate labelled. If you cannot draw it, your production agent is opaque.
- Split latency metrics: model time vs tool time per user-visible reply. An aggregate figure hides which hop is slow.
- Measure MCP cold-start from a fresh process - that is what a first-morning user experiences.
- Audit write tools for idempotency keys before moving any to managed mode.
- Tool count check: past ~25 tools, evaluate deferred schema loading to reduce input token cost.
Managed execution shrinks code; it does not shrink accountability. The chat looks the same to the user either way. What changes is whether you can see the loops between their question and the answer - and whether you find out about failures before or after they do.
nJoy 😉