Lesson 51 of 55 (Capstone): PostgreSQL Query Agent With OpenAI and MCP

This capstone project builds a complete, production-ready PostgreSQL query agent using OpenAI GPT-4o and MCP. By the end you will have a fully functional system where a user can ask questions in natural language and the agent translates them to safe, parameterized SQL queries, executes them against a real PostgreSQL database, formats the results, and explains its reasoning. The project incorporates lessons from throughout the course: schema validation, tool safety, audit logging, retry logic, and graceful shutdown.
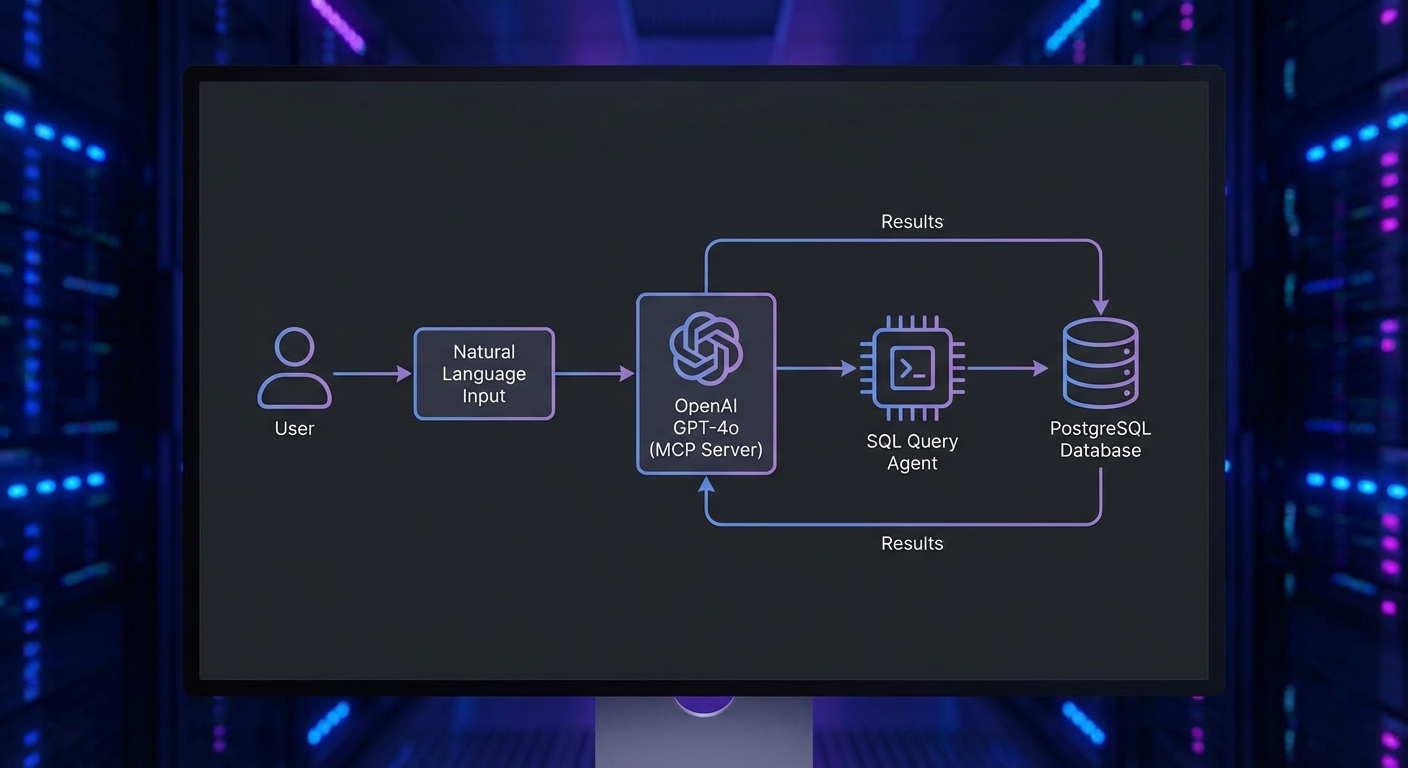
PostgreSQL query agent architecture diagram OpenAI GPT-4o MCP server database tools natural language SQL dark
The database query agent: user asks a question, GPT-4o plans SQL queries, MCP tools execute them safely.

Project Structure

mcp-db-agent/
├── package.json         (type: module, node 22+)
├── .env                 (DATABASE_URL, OPENAI_API_KEY)
├── servers/
│   └── db-server.js     (MCP server with database tools)
├── agent/
│   └── query-agent.js   (OpenAI + MCP client loop)
├── lib/
│   ├── db.js            (PostgreSQL connection pool)
│   ├── audit.js         (Audit logger)
│   └── safety.js        (SQL safety checks)
└── index.js             (CLI entry point)

The MCP Database Server

// servers/db-server.js
import { McpServer } from '@modelcontextprotocol/sdk/server/mcp.js';
import { StdioServerTransport } from '@modelcontextprotocol/sdk/server/stdio.js';
import { z } from 'zod';
import pg from 'pg';

const pool = new pg.Pool({ connectionString: process.env.DATABASE_URL });
const server = new McpServer({ name: 'db-server', version: '1.0.0' });

// Tool 1: List available tables
server.tool('list_tables', {}, async () => {
  const { rows } = await pool.query(
    "SELECT table_name, table_type FROM information_schema.tables WHERE table_schema = 'public' ORDER BY table_name"
  );
  return { content: [{ type: 'text', text: JSON.stringify(rows) }] };
});

// Tool 2: Describe a table's columns
server.tool('describe_table', {
  table_name: z.string().regex(/^[a-zA-Z_][a-zA-Z0-9_]*$/, 'Invalid table name'),
}, async ({ table_name }) => {
  const { rows } = await pool.query(
    'SELECT column_name, data_type, is_nullable, column_default FROM information_schema.columns WHERE table_schema = $1 AND table_name = $2 ORDER BY ordinal_position',
    ['public', table_name]
  );
  if (rows.length === 0) {
    return { content: [{ type: 'text', text: `Table '${table_name}' not found` }], isError: true };
  }
  return { content: [{ type: 'text', text: JSON.stringify(rows) }] };
});

// Tool 3: Execute a read-only query (SELECT only)
server.tool('execute_query', {
  sql: z.string().max(2000),
  params: z.array(z.union([z.string(), z.number(), z.null()])).max(20).default([]),
}, async ({ sql, params }) => {
  // Safety check: only allow SELECT statements
  const normalizedSql = sql.trim().toUpperCase();
  if (!normalizedSql.startsWith('SELECT') && !normalizedSql.startsWith('WITH')) {
    return { content: [{ type: 'text', text: 'Only SELECT queries are allowed' }], isError: true };
  }

  // Forbid dangerous keywords
  const dangerous = ['DROP', 'DELETE', 'UPDATE', 'INSERT', 'ALTER', 'TRUNCATE', 'GRANT', 'REVOKE'];
  if (dangerous.some(kw => normalizedSql.includes(kw))) {
    return { content: [{ type: 'text', text: 'Query contains forbidden keywords' }], isError: true };
  }

  try {
    const { rows, rowCount } = await pool.query(sql, params);
    return {
      content: [{ type: 'text', text: JSON.stringify({ rows: rows.slice(0, 100), total: rowCount, truncated: rowCount > 100 }) }],
    };
  } catch (err) {
    return { content: [{ type: 'text', text: `Query failed: ${err.message}` }], isError: true };
  }
});

// Tool 4: Get row count (for planning queries)
server.tool('count_rows', {
  table_name: z.string().regex(/^[a-zA-Z_][a-zA-Z0-9_]*$/),
  where_clause: z.string().max(500).optional(),
}, async ({ table_name, where_clause }) => {
  const sql = where_clause
    ? `SELECT COUNT(*) as count FROM ${table_name} WHERE ${where_clause}`
    : `SELECT COUNT(*) as count FROM ${table_name}`;
  const { rows } = await pool.query(sql);
  return { content: [{ type: 'text', text: JSON.stringify(rows[0]) }] };
});

const transport = new StdioServerTransport();
await server.connect(transport);
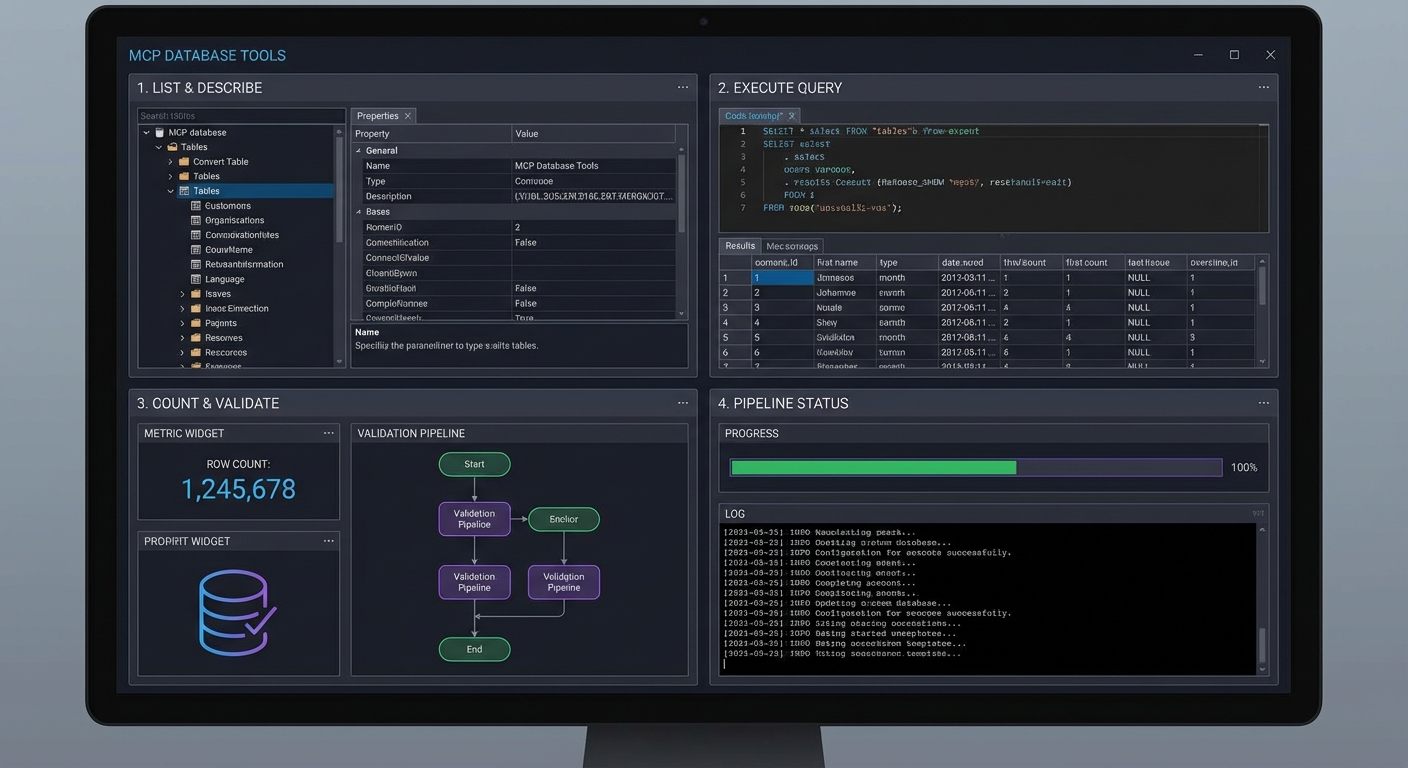
Four database MCP tools list_tables describe_table execute_query count_rows with safety validation dark
Four tools: schema discovery (list, describe), safe query execution, and row counting for query planning.

In practice, this four-tool design is intentional: it mirrors how a careful human analyst works. Rather than handing the model a single “run any SQL” tool, you force it through a discovery workflow – list tables, inspect columns, then query. This staged approach dramatically reduces hallucinated column names and malformed joins because the model sees the real schema before writing SQL.

Watch the safety check in execute_query closely. The keyword blocklist approach is simple but brittle – a query like SELECT * FROM updates would be rejected because “UPDATE” appears in the table name. In a production system, you would use a proper SQL parser or run queries through a read-only database user instead of string matching.

The OpenAI Query Agent

// agent/query-agent.js
import OpenAI from 'openai';
import { Client } from '@modelcontextprotocol/sdk/client/index.js';
import { StdioClientTransport } from '@modelcontextprotocol/sdk/client/stdio.js';

const openai = new OpenAI();

export async function createQueryAgent() {
  const transport = new StdioClientTransport({
    command: 'node',
    args: ['./servers/db-server.js'],
    env: { ...process.env },
  });
  const mcp = new Client({ name: 'query-agent', version: '1.0.0' });
  await mcp.connect(transport);
  const { tools: mcpTools } = await mcp.listTools();

  const tools = mcpTools.map(t => ({
    type: 'function',
    function: { name: t.name, description: t.description, parameters: t.inputSchema, strict: true },
  }));

  const SYSTEM_PROMPT = `You are a precise database analyst.
You have access to a PostgreSQL database. To answer questions:
1. First call list_tables to see available tables
2. Call describe_table for tables relevant to the question
3. Plan a safe SELECT query (use parameters for any user values)
4. Call execute_query with the query and parameters
5. Present results clearly with a brief interpretation

Always use parameterized queries. Never build SQL by string concatenation.
If a question cannot be answered with a SELECT, say so clearly.`;

  return {
    async query(userQuestion) {
      const messages = [
        { role: 'system', content: SYSTEM_PROMPT },
        { role: 'user', content: userQuestion },
      ];
      let turns = 0;

      while (true) {
        const response = await openai.chat.completions.create({
          model: 'gpt-4o', messages, tools, tool_choice: 'auto',
        });
        const msg = response.choices[0].message;
        messages.push(msg);

        if (msg.finish_reason !== 'tool_calls') {
          return msg.content;
        }

        if (++turns > 10) throw new Error('Max turns exceeded');

        const results = await Promise.all(msg.tool_calls.map(async tc => {
          const args = JSON.parse(tc.function.arguments);
          const result = await mcp.callTool({ name: tc.function.name, arguments: args });
          const text = result.content.filter(c => c.type === 'text').map(c => c.text).join('\n');
          return { role: 'tool', tool_call_id: tc.id, content: text };
        }));
        messages.push(...results);
      }
    },
    async close() { await mcp.close(); },
  };
}

The agent loop here follows the same pattern you have seen throughout the course, but notice the turn cap of 10. Without it, a confusing question could cause the model to loop indefinitely – calling tools, misinterpreting results, and calling more tools. In a billing-sensitive environment, a runaway loop like that translates directly into unexpected API costs.

Running the Agent

// index.js
import { createQueryAgent } from './agent/query-agent.js';
import readline from 'node:readline';

const agent = await createQueryAgent();
const rl = readline.createInterface({ input: process.stdin, output: process.stdout });

console.log('PostgreSQL Query Agent ready. Ask anything about your data.');
console.log('Type "exit" to quit.\n');

rl.on('line', async (line) => {
  if (line.trim() === 'exit') { await agent.close(); process.exit(0); }
  if (!line.trim()) return;
  try {
    const answer = await agent.query(line);
    console.log('\n' + answer + '\n');
  } catch (err) {
    console.error('Error:', err.message);
  }
});

Teams commonly deploy this exact pattern as an internal analytics bot on Slack or Teams. A support engineer asks “how many orders shipped last week from warehouse 3?” and gets an answer in seconds, without needing SQL skills or database access credentials. The read-only constraint means the bot is safe to hand to non-technical staff.

What to Extend

  • Add the audit logging middleware from Lesson 35 to log every execute_query call with the SQL, user, and result count.
  • Add a sample_rows tool that returns 3 rows from any table – helps the model understand data format before writing queries.
  • Connect it to your real production database with a read-only service account.

nJoy 😉
Lesson 50 of 55: Custom MCP Transports and Protocol Extensions in Node.js

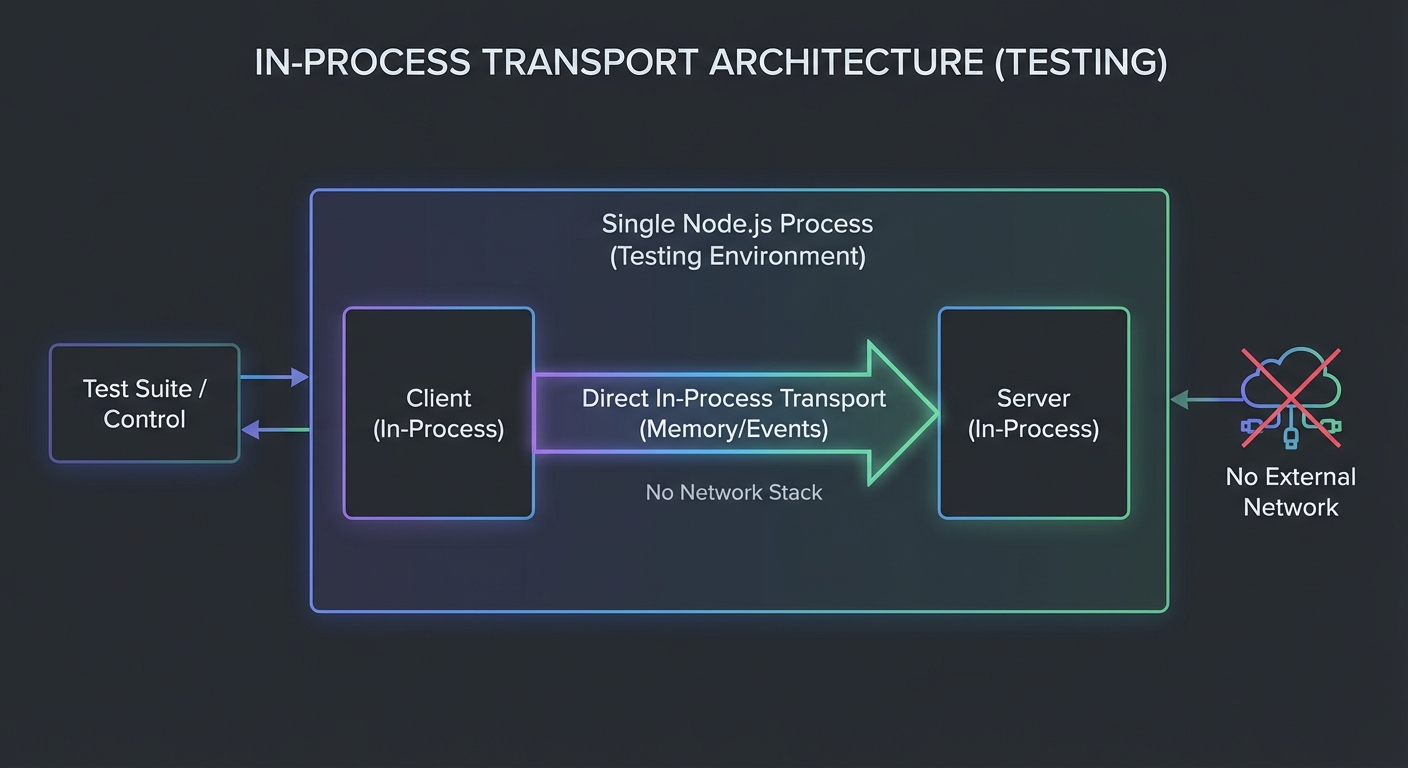
The MCP SDK ships with two built-in transports: stdio and Streamable HTTP. These cover the vast majority of use cases. But sometimes you need something different: an in-process transport for testing, a WebSocket transport for browser environments, an IPC transport for Electron apps, or a transport that encrypts the JSON-RPC stream at the application layer. The SDK’s transport interface is deliberately minimal, making it straightforward to implement your own. This lesson covers the interface, two reference implementations, and practical extension points.

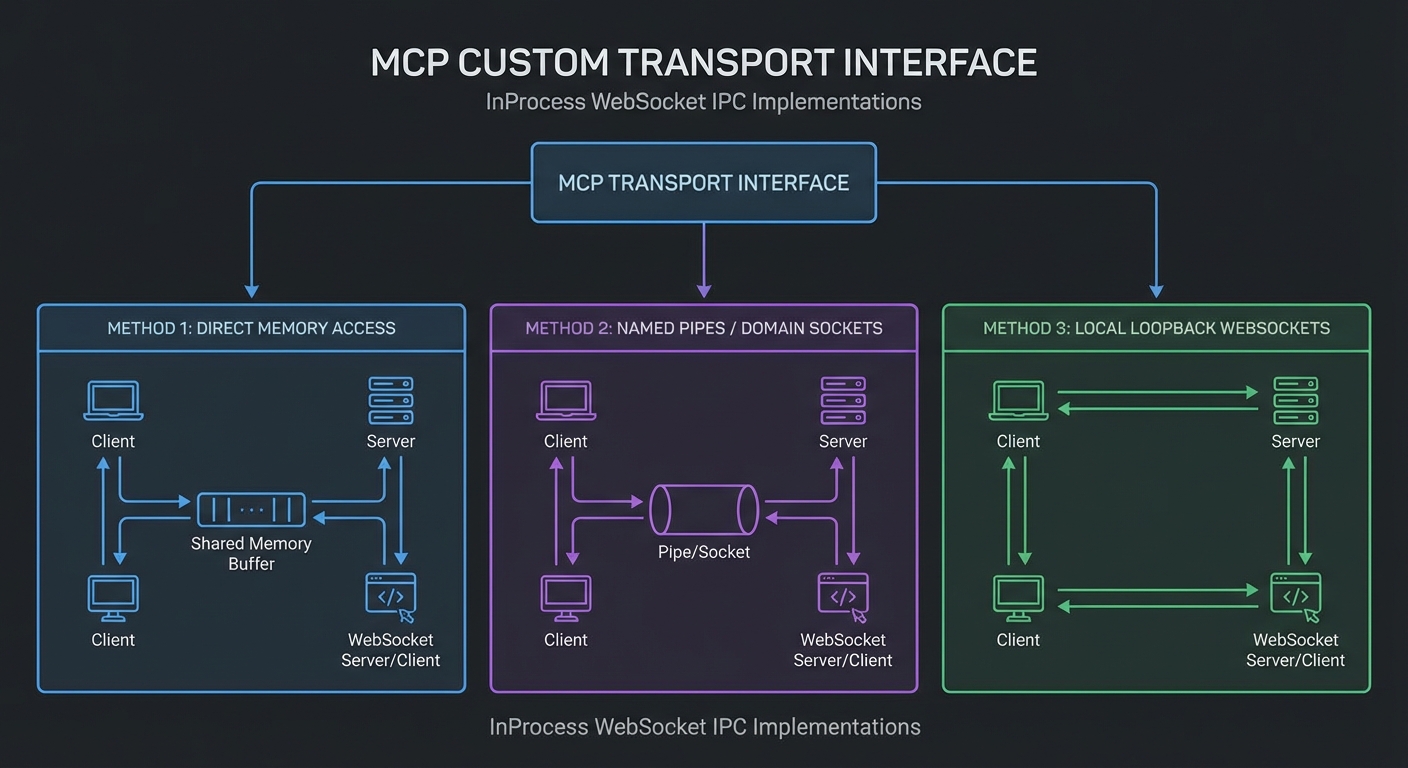
MCP custom transport interface diagram showing Transport interface implementations InProcess WebSocket IPC dark
The Transport interface is three methods: start, send, and close. Any communication channel can become an MCP transport.

The Transport Interface

// The MCP SDK Transport interface (TypeScript definition for reference)
// interface Transport {
//   start(): Promise;
//   send(message: JSONRPCMessage): Promise;
//   close(): Promise;
//   onmessage?: (message: JSONRPCMessage) => void;
//   onerror?: (error: Error) => void;
//   onclose?: () => void;
// }

// In JavaScript, implement the same shape:
class CustomTransport {
  onmessage = null;   // Called when a message is received
  onerror = null;     // Called on transport errors
  onclose = null;     // Called when the transport closes

  async start() {
    // Initialize the underlying communication channel
  }

  async send(message) {
    // Send a JSONRPCMessage object
  }

  async close() {
    // Clean up the channel
  }
}

The interface is intentionally minimal: three async methods and three event callbacks. This simplicity is the point. Any communication channel that can send and receive JSON objects – WebSockets, Unix domain sockets, shared memory, even a pair of browser MessageChannels – can become an MCP transport by implementing these six members.

In-Process Transport for Testing

An in-process transport connects a client directly to a server in the same Node.js process. Essential for integration tests without spawning subprocesses:

// in-process-transport.js

export function createInProcessTransport() {
  let clientTransport, serverTransport;

  clientTransport = {
    onmessage: null, onerror: null, onclose: null,
    async start() {},
    async send(msg) {
      // Route to server
      if (serverTransport.onmessage) serverTransport.onmessage(msg);
    },
    async close() {
      if (clientTransport.onclose) clientTransport.onclose();
      if (serverTransport.onclose) serverTransport.onclose();
    },
  };

  serverTransport = {
    onmessage: null, onerror: null, onclose: null,
    async start() {},
    async send(msg) {
      // Route to client
      if (clientTransport.onmessage) clientTransport.onmessage(msg);
    },
    async close() {
      if (clientTransport.onclose) clientTransport.onclose();
      if (serverTransport.onclose) serverTransport.onclose();
    },
  };

  return { clientTransport, serverTransport };
}

// Usage in tests:
import { test } from 'node:test';
import { Client } from '@modelcontextprotocol/sdk/client/index.js';
import { McpServer } from '@modelcontextprotocol/sdk/server/mcp.js';
import { createInProcessTransport } from './in-process-transport.js';

test('in-process round trip', async (t) => {
  const { clientTransport, serverTransport } = createInProcessTransport();
  const server = buildServer();
  const client = new Client({ name: 'test', version: '1.0.0' });

  await server.connect(serverTransport);
  await client.connect(clientTransport);

  const { tools } = await client.listTools();
  assert.ok(tools.length > 0);

  await client.close();
});

This in-process transport eliminates the main pain point of MCP integration tests: subprocess management. No ports to allocate, no processes to spawn and kill, no race conditions between server startup and client connection. Tests using this pattern typically run 10-50x faster than their subprocess equivalents.

In-process transport diagram client and server connected directly in same process for testing no network dark
In-process transport: no network, no subprocess, instant round trip – ideal for unit and integration testing.

WebSocket Transport

npm install ws
// websocket-transport.js - client side
import WebSocket from 'ws';

export class WebSocketClientTransport {
  #url;
  #ws = null;
  onmessage = null;
  onerror = null;
  onclose = null;

  constructor(url) {
    this.#url = url;
  }

  async start() {
    return new Promise((resolve, reject) => {
      this.#ws = new WebSocket(this.#url);
      this.#ws.once('open', resolve);
      this.#ws.once('error', reject);
      this.#ws.on('message', (data) => {
        try {
          const msg = JSON.parse(data.toString());
          if (this.onmessage) this.onmessage(msg);
        } catch (err) {
          if (this.onerror) this.onerror(err);
        }
      });
      this.#ws.on('close', () => {
        if (this.onclose) this.onclose();
      });
      this.#ws.on('error', (err) => {
        if (this.onerror) this.onerror(err);
      });
    });
  }

  async send(message) {
    this.#ws.send(JSON.stringify(message));
  }

  async close() {
    this.#ws?.close();
  }
}

// WebSocket server transport
export class WebSocketServerTransport {
  #socket;
  onmessage = null;
  onerror = null;
  onclose = null;

  constructor(socket) {
    this.#socket = socket;
    socket.on('message', (data) => {
      try {
        const msg = JSON.parse(data.toString());
        if (this.onmessage) this.onmessage(msg);
      } catch (err) {
        if (this.onerror) this.onerror(err);
      }
    });
    socket.on('close', () => {
      if (this.onclose) this.onclose();
    });
  }

  async start() {}

  async send(message) {
    this.#socket.send(JSON.stringify(message));
  }

  async close() {
    this.#socket.close();
  }
}

// Server side: wrap ws.WebSocketServer
import { WebSocketServer } from 'ws';
import { McpServer } from '@modelcontextprotocol/sdk/server/mcp.js';

const wss = new WebSocketServer({ port: 9000 });
wss.on('connection', async (socket) => {
  const transport = new WebSocketServerTransport(socket);
  const server = buildMcpServer();
  await server.connect(transport);
});

WebSocket transport is the natural choice when your MCP client runs in a browser. Unlike Streamable HTTP, which requires the client to open new connections for each request, a WebSocket keeps a single persistent bidirectional channel open. The trade-off is that WebSocket connections are harder to load-balance (no standard sticky-session mechanism) and are not part of the official MCP spec, so you take on compatibility risk.

Protocol Extensions: Custom Methods

Beyond custom transports, MCP’s JSON-RPC foundation lets you add entirely new methods outside the spec. Prefixing them with your company namespace (like com.mycompany/) avoids collisions with future spec additions. This is useful for operational tooling – metrics, health checks, debug endpoints – that your internal clients need but that do not belong in the standard tool/resource model.

// MCP allows custom methods beyond the spec - they are prefixed with your namespace
// Use this for proprietary extensions that are specific to your deployment

// Server side: handle a custom method
server.server.setRequestHandler(
  { method: 'com.mycompany/getServerMetrics' },
  async (request) => {
    return {
      uptime: process.uptime(),
      activeSessions: sessionStore.size,
      memoryMB: Math.round(process.memoryUsage().heapUsed / 1024 / 1024),
    };
  }
);

// Client side: call a custom method
const metrics = await client.request(
  { method: 'com.mycompany/getServerMetrics', params: {} },
  /* ResultSchema */ undefined
);

One thing to watch out for with custom methods: they are invisible to standard MCP clients. If you add com.mycompany/getServerMetrics, only clients you control will know it exists. Standard MCP clients will not discover or call these methods via listTools, since they are not tools. Use them for internal operational purposes, not for functionality you expect third-party clients to use.

The extensions Capability Field

New in Draft – This feature is in the Draft spec and may be finalised in a future revision.

The Draft specification adds an extensions field to both ClientCapabilities and ServerCapabilities. This provides a standardised place to advertise optional protocol extensions beyond the core spec, replacing the ad-hoc approach of custom methods and namespaced capabilities.

// Server declaring support for a custom extension during initialization
{
  capabilities: {
    tools: {},
    resources: {},
    extensions: {
      'com.mycompany/streaming-progress': {
        version: '1.0.0',
      },
      'com.mycompany/team-collaboration': {
        version: '2.1.0',
      },
    },
  },
}

// Client checking for extension support
const serverCaps = client.getServerCapabilities();
if (serverCaps?.extensions?.['com.mycompany/streaming-progress']) {
  // Enable the streaming progress UI
}

The extensions field gives custom methods a discoverable surface. Instead of blindly calling com.mycompany/getServerMetrics and hoping it exists, a client can check capabilities.extensions during initialisation and adapt its behaviour. Namespace your extensions with a reverse-domain prefix (like Java packages) to avoid collisions with future spec additions or other vendors.

What to Build Next

  • Replace subprocess spawning in your integration tests with the in-process transport. Measure the test speedup.
  • If you have a browser-based MCP client, implement the WebSocket transport and test it against your existing MCP server with a WebSocket adapter.

nJoy 😉

Lesson 49 of 55: MCP Protocol Versioning, Compatibility, and Migration

The MCP specification evolves. New capabilities are added; some older mechanisms are deprecated; breaking changes occasionally ship. Building MCP servers that handle protocol version negotiation correctly means your clients and servers can interoperate across version boundaries without hard dependencies on a single spec revision. This lesson covers how MCP versioning works, how to negotiate capabilities with older clients, how to write migration guides when your own server schema changes, and the stability guarantees you can rely on from Anthropic.

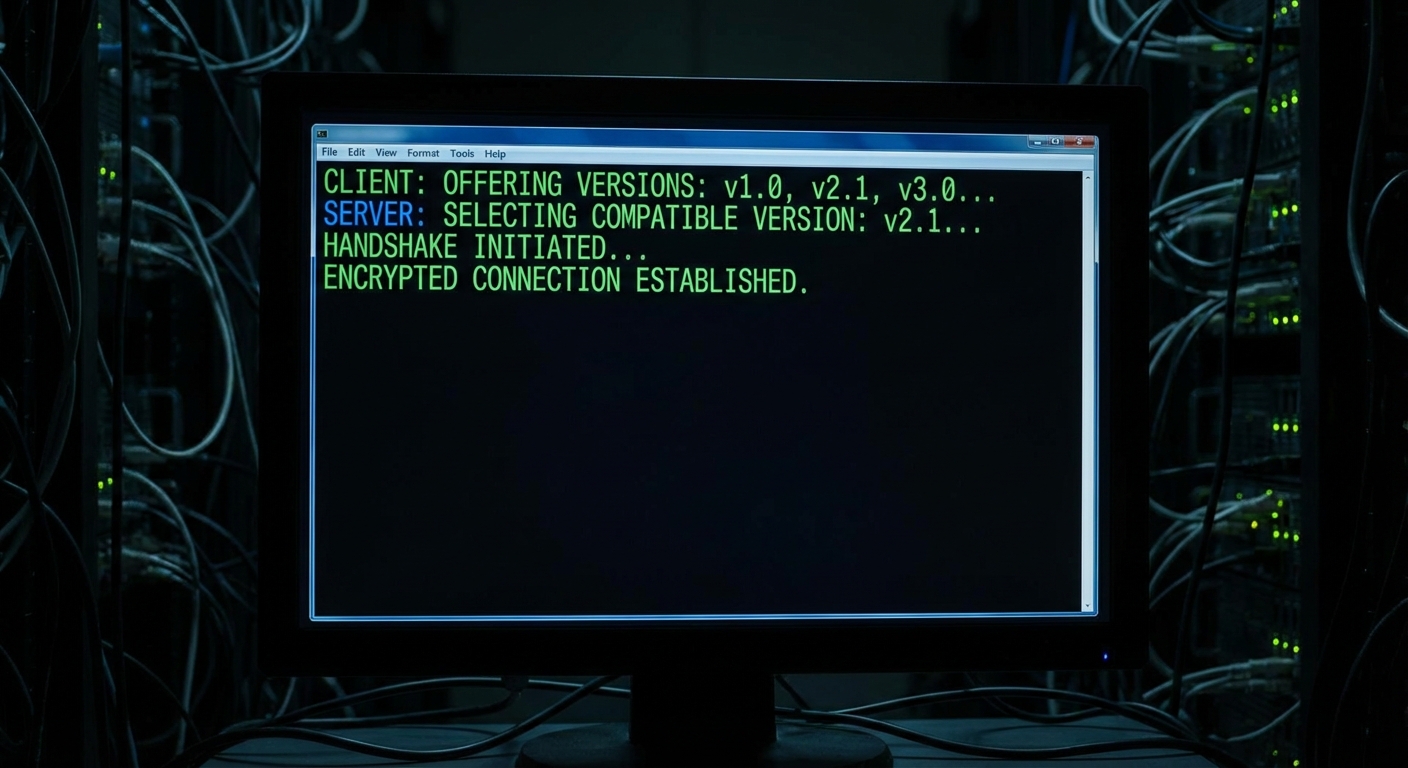
MCP protocol versioning negotiation diagram client offering versions server selecting compatible version dark
MCP version negotiation: client offers supported versions, server selects the best match.

How MCP Protocol Versioning Works

MCP uses date-stamped version strings like 2024-11-05 or 2025-11-25. During initialization, the client sends the version it wants, and the server responds with the version it will use (typically the same, or the highest version both sides support). If they cannot agree, the connection fails at initialization.

// Initialization exchange (JSON-RPC)
// Client sends:
{
  "jsonrpc": "2.0",
  "id": 1,
  "method": "initialize",
  "params": {
    "protocolVersion": "2025-11-25",
    "clientInfo": { "name": "my-client", "version": "2.0.0" },
    "capabilities": { "sampling": {}, "elicitation": {} }
  }
}

// Server responds with the version it accepts:
{
  "jsonrpc": "2.0",
  "id": 1,
  "result": {
    "protocolVersion": "2025-11-25",
    "serverInfo": { "name": "my-server", "version": "1.5.0" },
    "capabilities": { "tools": {}, "resources": {}, "prompts": {} }
  }
}
// The @modelcontextprotocol/sdk handles version negotiation automatically
// You do not need to implement it manually

// To check the negotiated version in your server:
server.server.oninitialized = () => {
  const version = server.server.negotiatedProtocolVersion;
  console.log(`MCP session initialized with protocol version: ${version}`);
};

In practice, you rarely implement version negotiation by hand – the SDK handles it for you. The important thing is understanding what happens under the hood: if a client sends a version your server’s SDK does not support, the connection fails at initialization with a clear error. Logging the negotiated version on startup (as shown above) helps you quickly diagnose “why can’t this client connect?” issues in production.

Feature Detection (Capability Negotiation)

// Check if the connected client supports a specific capability
// before using it in your server code

server.server.oninitialized = () => {
  const clientCaps = server.server.getClientCapabilities();

  const supportsElicitation = !!clientCaps?.elicitation;
  const supportsSampling = !!clientCaps?.sampling;
  const supportsRoots = !!clientCaps?.roots;

  console.log(`Client capabilities: elicitation=${supportsElicitation} sampling=${supportsSampling} roots=${supportsRoots}`);

  if (!supportsElicitation) {
    // Fall back to returning instructions in tool result instead of interactive elicitation
    console.warn('Client does not support elicitation - using text fallback');
  }
};

This matters in real deployments because not all MCP clients are equal. Claude Desktop supports elicitation and sampling, but a custom CLI client you built might not. If your server blindly calls server.createElicitation() against a client that did not declare the capability, the request will fail. Checking capabilities first and providing a text-based fallback keeps your server compatible with the broadest range of clients.

Capability negotiation table client declares capabilities server checks before using elicitation sampling roots dark
Always check client capabilities before using server-initiated features like elicitation or sampling.

Migrating Your Tool Schema

When you change a tool’s input schema, existing clients that have cached the old schema will break. Follow a compatibility-first migration process:

// Backwards-compatible schema evolution: add optional fields, never remove required ones

// Version 1 schema (existing clients use this)
// search_products: { query: z.string(), limit: z.number().optional().default(10) }

// Version 2: add optional 'category' filter without breaking v1 clients
server.tool('search_products', {
  query: z.string(),
  limit: z.number().optional().default(10),
  category: z.string().optional(),           // New optional field - backwards compatible
  // NEVER remove or rename 'query' or 'limit' - that breaks v1 clients
  // NEVER make an optional field required - that also breaks v1 clients
}, handler);
// Breaking change strategy: add a versioned tool name during transition
// Phase 1: add new tool alongside old one
server.tool('search_products_v2', {
  query: z.string(),
  limit: z.number().optional().default(10),
  filters: z.object({  // New required field - would break v1 if added to original
    category: z.string().optional(),
    priceMax: z.number().optional(),
    inStock: z.boolean().optional().default(true),
  }),
}, handler);

// Phase 2: deprecate old tool via description
// server.tool('search_products', ... 
//   description: 'DEPRECATED: use search_products_v2 instead'

// Phase 3 (after client migration window): remove old tool

The biggest gotcha with schema migration is that LLM clients cache tool definitions. Even after you update the server, an agent might still send arguments matching the old schema until it re-fetches the tool list. Making new fields optional (or using versioned tool names) ensures that stale cached schemas do not cause hard failures during the transition window.

Version Compatibility Matrix

The MCP specification has gone through four published revisions. Each is backwards-incompatible with the previous, which is why the date changes. A Draft version tracks work-in-progress changes that have not yet shipped.

MCP Spec Version Status Key Features Added
2024-11-05 Final Initial release: tools, resources, prompts, sampling, stdio transport, HTTP+SSE transport
2025-03-26 Final OAuth 2.1 authorization framework, Streamable HTTP transport (replaces HTTP+SSE), tool annotations (destructiveHint, readOnlyHint, etc.), JSON-RPC batching, audio content type, completions capability
2025-06-18 Final Elicitation (server asks user for input), structured tool output, resource links in tool results, removed JSON-RPC batching, OAuth resource server classification (RFC 8707), MCP-Protocol-Version header required on HTTP, title field for human-friendly names
2025-11-25 Current Experimental tasks API (durable request tracking), OAuth Client ID Metadata Documents, tool calling in sampling requests, URL mode elicitation, enhanced authorization with incremental scope consent, icon metadata for tools/resources/prompts, OpenID Connect Discovery support, SSE polling
Draft Draft Work in progress: extensions field on capabilities, OpenTelemetry trace context propagation in _meta, SEP workflow formalisation. Do not target Draft in production.

The version jumps tell you something important: 2025-03-26 shipped tool annotations and a new transport. 2025-06-18 then removed JSON-RPC batching that 2025-03-26 had just added – proof that the spec is willing to walk back decisions quickly. Always check the changelog between your current version and the target version before upgrading.

Stability Guarantees

With four published spec revisions in roughly 18 months, a reasonable question is: what can I actually depend on? The list below separates the stable foundations from the parts that have already changed between versions.

  • JSON-RPC 2.0 wire format: Stable. Will not change between spec versions.
  • Core methods (initialize, tools/call, resources/read, prompts/get): Stable across all versions.
  • New capabilities: Always added as optional; never required for a functional server.
  • Removals: Features can be removed between versions (JSON-RPC batching was added in 2025-03-26 and removed in 2025-06-18). Pin your protocol version in production.
  • SDK APIs: The TypeScript/JavaScript SDK minor versions maintain backwards compatibility; only major versions may include breaking changes.

2026 Roadmap Priorities

2026 Roadmap (blog.modelcontextprotocol.io)

The MCP project published a 2026 roadmap organised around Working Group priorities rather than fixed release dates. The two highest-priority areas reflect production deployment needs:

  • Transport Evolution and Scalability: Addressing gaps in Streamable HTTP for production deployments. Focus areas include horizontal scaling without server-side state holding, standard session handling mechanisms, and a .well-known metadata format for server capability discovery. The goal is to keep the set of official transports small (a core MCP principle) while making them production-ready for enterprise-scale clusters.
  • Agent Communication: Expanding the experimental Tasks primitive with lifecycle improvements including retry semantics for transient failures, expiry policies for task results, and better integration with multi-agent orchestration patterns. This builds directly on the Tasks API introduced in 2025-11-25.

The shift from date-driven releases to Working Group-driven priorities signals that MCP is entering a production-hardening phase. For course readers: pin to 2025-11-25 in production, watch the roadmap for transport and tasks changes, and participate in Working Groups if you want to shape the next spec revision.

What to Build Next

  • Add a server://version resource to your MCP server that returns the current protocol version, SDK version, and your tool schema versions. Update it on every release.
  • Review your most-used tools for any fields that are currently optional but should be made required. Use the v2 naming strategy to transition safely.

nJoy 😉

Lesson 48 of 55: Cancellation, Progress, and Backpressure in MCP Streams

Streaming responses, long-running tools, and multi-step agent pipelines all share a common challenge: what happens when the client stops listening? Without proper cancellation propagation, cancelled client connections leave expensive operations running on the server indefinitely. This lesson covers three related mechanisms: request cancellation using AbortSignal, progress reporting with real-time updates, and backpressure strategies that prevent fast producers from overwhelming slow consumers.

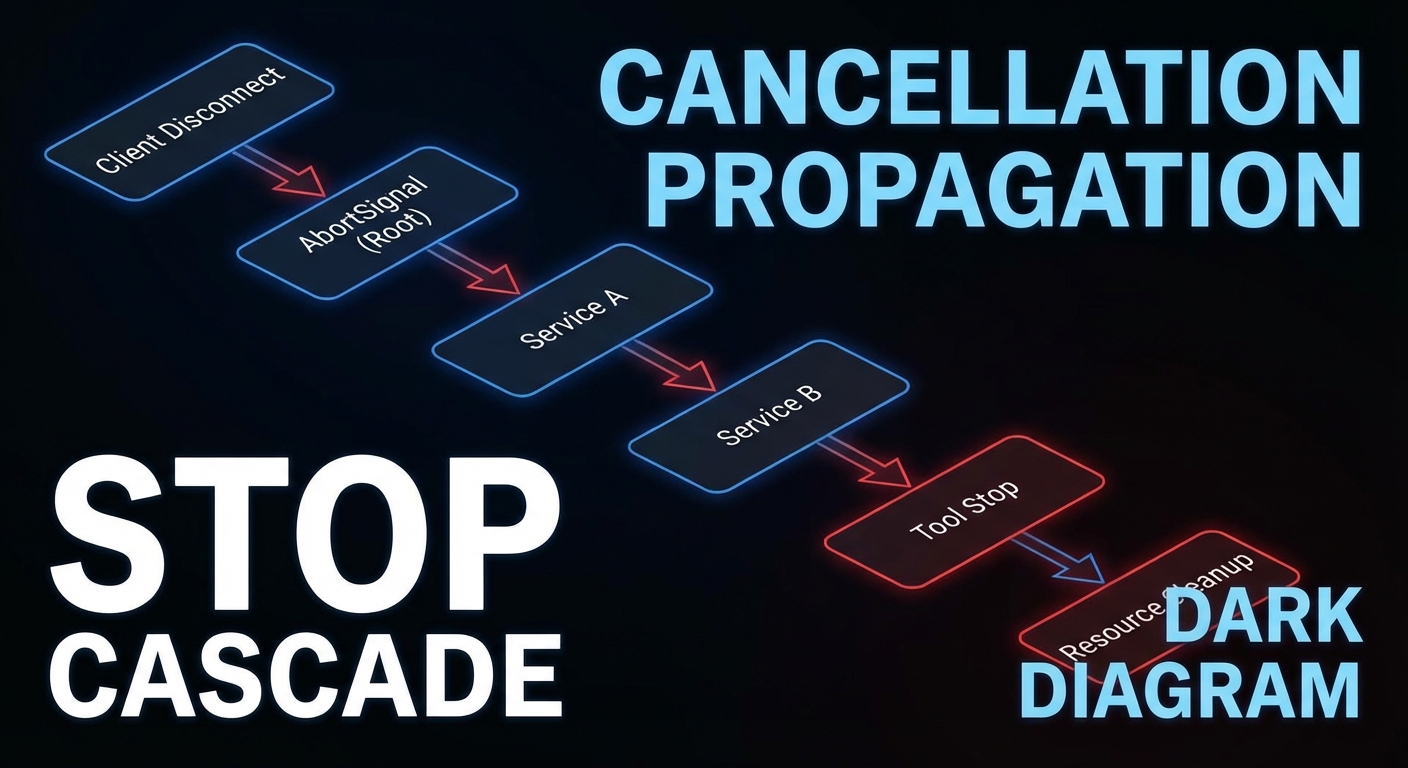
Cancellation propagation diagram client disconnect AbortSignal tool cleanup chain stop resource release dark
Cancellation must propagate through the entire call chain: from client disconnect to every active resource.

AbortSignal in MCP Tool Handlers

When a client disconnects or cancels a request, the MCP SDK calls server.setRequestHandler‘s signal. Tool handlers should check this signal and abort expensive operations:

import { McpServer } from '@modelcontextprotocol/sdk/server/mcp.js';
import { z } from 'zod';

const server = new McpServer({ name: 'streaming-server', version: '1.0.0' });

server.tool('search_large_dataset', {
  query: z.string(),
  maxResults: z.number().default(100),
}, async ({ query, maxResults }, { signal }) => {
  // Pass signal to database query
  const results = await db.search(query, { maxResults, signal });

  // Pass signal to downstream HTTP calls
  const enriched = await Promise.all(
    results.map(r =>
      fetch(`https://enrichment.api/v1/${r.id}`, { signal })
        .then(res => res.json())
        .catch(err => {
          if (err.name === 'AbortError') throw err;  // Re-throw cancellation
          return r;  // Return unenriched on other errors
        })
    )
  );

  return { content: [{ type: 'text', text: JSON.stringify(enriched) }] };
});

The key insight here is that signal must be threaded through every async boundary. If you pass it to fetch but not to your database query, a cancelled request still hammers the database while the HTTP calls abort cleanly. Every layer of your call stack that does I/O should receive and respect the signal.

// In database clients that support AbortSignal
async function search(query, { maxResults, signal } = {}) {
  const client = await pool.connect();

  // Register cleanup on signal abort
  const cleanup = () => {
    client.query('SELECT pg_cancel_backend(pg_backend_pid())').catch(() => {});
    client.release();
  };

  signal?.addEventListener('abort', cleanup, { once: true });

  try {
    const result = await client.query(
      'SELECT * FROM products WHERE to_tsvector(description) @@ plainto_tsquery($1) LIMIT $2',
      [query, maxResults]
    );
    return result.rows;
  } finally {
    signal?.removeEventListener('abort', cleanup);
    client.release();
  }
}

A common mistake in the database cleanup pattern above is forgetting to call removeEventListener in the finally block. Without it, a completed query still has a dangling abort listener that fires if the signal is aborted later in the request lifecycle, potentially cancelling an already-released connection and corrupting your connection pool state.

Progress Reporting via Streaming Tool Results

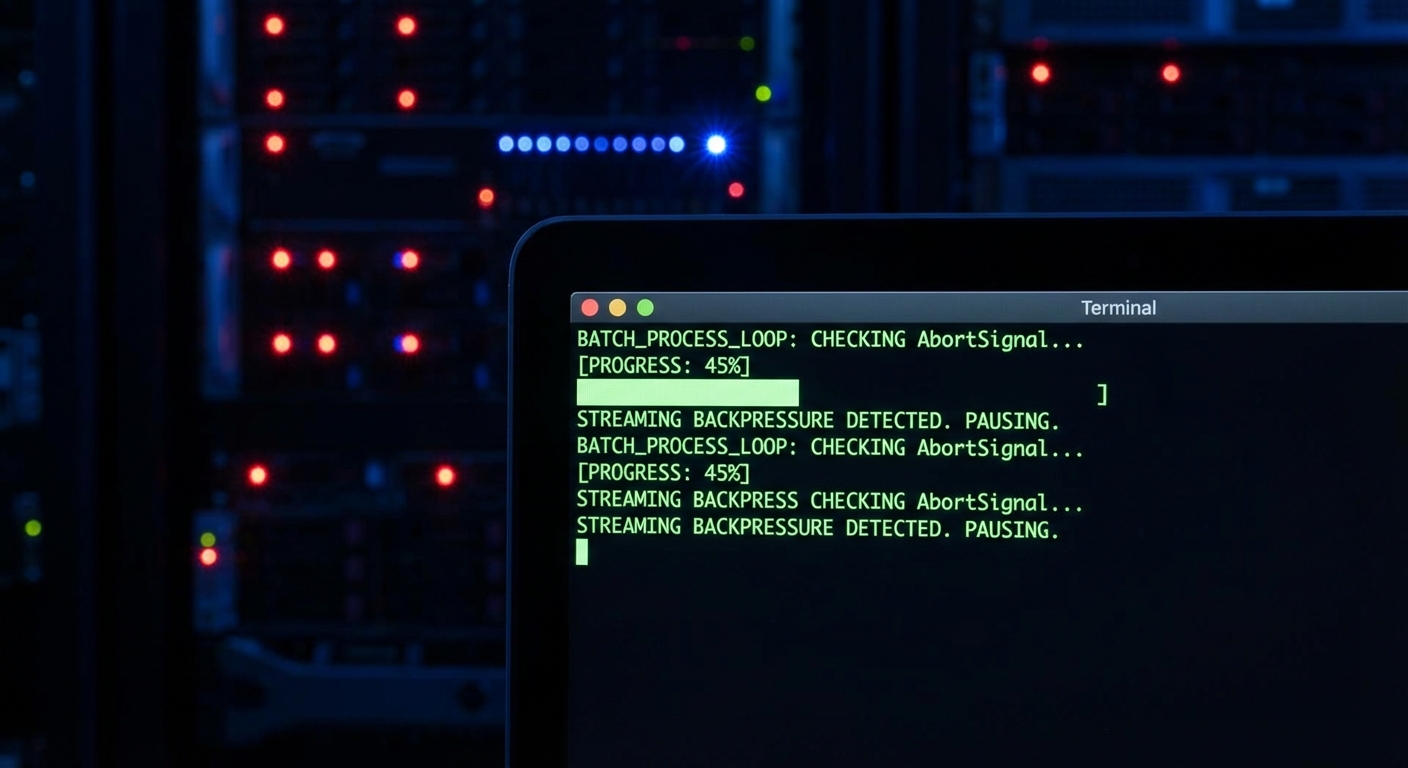
Cancellation handles the “stop” case. Progress reporting handles the “how far along are we?” case. For batch operations that take minutes, silence from the server is indistinguishable from a hang. Emitting periodic progress via sendLoggingMessage lets monitoring tools and MCP Inspector show real-time status without changing the tool’s return type.

// MCP tools can emit progress events using the server's notification mechanism
// For now, progress is communicated via the task polling pattern from Lesson 45
// or via streaming text content updates

server.tool('process_batch', {
  items: z.array(z.string()).max(1000),
}, async ({ items }, { signal }) => {
  const results = [];
  const total = items.length;

  for (let i = 0; i < items.length; i++) {
    if (signal?.aborted) {
      return {
        content: [{ type: 'text', text: JSON.stringify({
          status: 'cancelled',
          processed: i,
          total,
          results,
        }) }],
      };
    }

    const result = await processItem(items[i]);
    results.push(result);

    // Emit progress via logs/notification (visible in MCP Inspector)
    if (i % 50 === 0) {
      server.server.sendLoggingMessage({
        level: 'info',
        data: `Progress: ${i + 1}/${total} (${Math.round(((i + 1) / total) * 100)}%)`,
      });
    }
  }

  return { content: [{ type: 'text', text: JSON.stringify({ status: 'complete', results }) }] };
});
Progress reporting pattern batch processing loop checking AbortSignal emitting log notifications at intervals dark
Batch tools check the AbortSignal on each iteration and emit progress via logging notifications.

Backpressure in Streaming Tool Results

Progress tells the client what is happening. Backpressure prevents the server from producing data faster than the client can consume it. Without backpressure, a tool that streams thousands of log lines can exhaust server memory buffering unsent data while the client processes earlier chunks. The generator pattern below yields control between batches, giving the runtime a chance to drain the outbound buffer.

// When a tool generates large amounts of streaming data,
// use a ReadableStream with backpressure control

server.tool('stream_logs', {
  service: z.string(),
  since: z.string(),
}, async ({ service, since }, { signal }) => {
  // Generator-based streaming with backpressure
  async function* generateLogs() {
    const logStream = await getLiveLogStream(service, since, { signal });
    let buffer = [];

    for await (const logLine of logStream) {
      if (signal?.aborted) break;
      buffer.push(logLine);

      // Yield batches of 50 lines to avoid overwhelming the response
      if (buffer.length >= 50) {
        yield buffer.join('\n');
        buffer = [];
        // Yield control to allow backpressure to work
        await new Promise(r => setImmediate(r));
      }
    }

    if (buffer.length > 0) yield buffer.join('\n');
  }

  // Collect all chunks (in practice, return first N lines for tool calls)
  const chunks = [];
  let totalLines = 0;

  for await (const chunk of generateLogs()) {
    chunks.push(chunk);
    totalLines += chunk.split('\n').length;
    if (totalLines > 500) {
      chunks.push('[...truncated, 500 line limit reached]');
      break;
    }
  }

  return { content: [{ type: 'text', text: chunks.join('\n') }] };
});

Handling SSE Client Disconnections

All of the above - cancellation, progress, backpressure - ultimately depends on detecting when the client is gone. For Streamable HTTP servers, the browser or HTTP client closing the connection triggers a socket close event. The code below wires that event to an AbortController, which the SDK then propagates to your tool handlers automatically.

// For Streamable HTTP servers, detect client disconnections via res.on('close')
app.post('/mcp', async (req, res) => {
  const transport = getOrCreateTransport(req);

  // Create an AbortController for this connection
  const controller = new AbortController();
  req.socket.on('close', () => controller.abort());

  // Pass the signal to the MCP transport (SDK handles propagation to tool handlers)
  await transport.handleRequest(req, res, req.body, { signal: controller.signal });
});

What to Build Next

  • Add signal?.addEventListener('abort', cleanup) to your longest-running tool handler. Test it by disconnecting the client mid-execution and verify resources are released.
  • Add a per-tool timeout using AbortSignal.timeout(ms) to prevent any single tool call from running indefinitely.

nJoy 😉

Lesson 47 of 55: MCP Tasks API – Long-Running Async Operations and Progress

New in 2025-11-25 (experimental) – The Tasks API replaced older DIY polling patterns with a protocol-level state machine. The entire feature is experimental and may evolve in future spec versions.

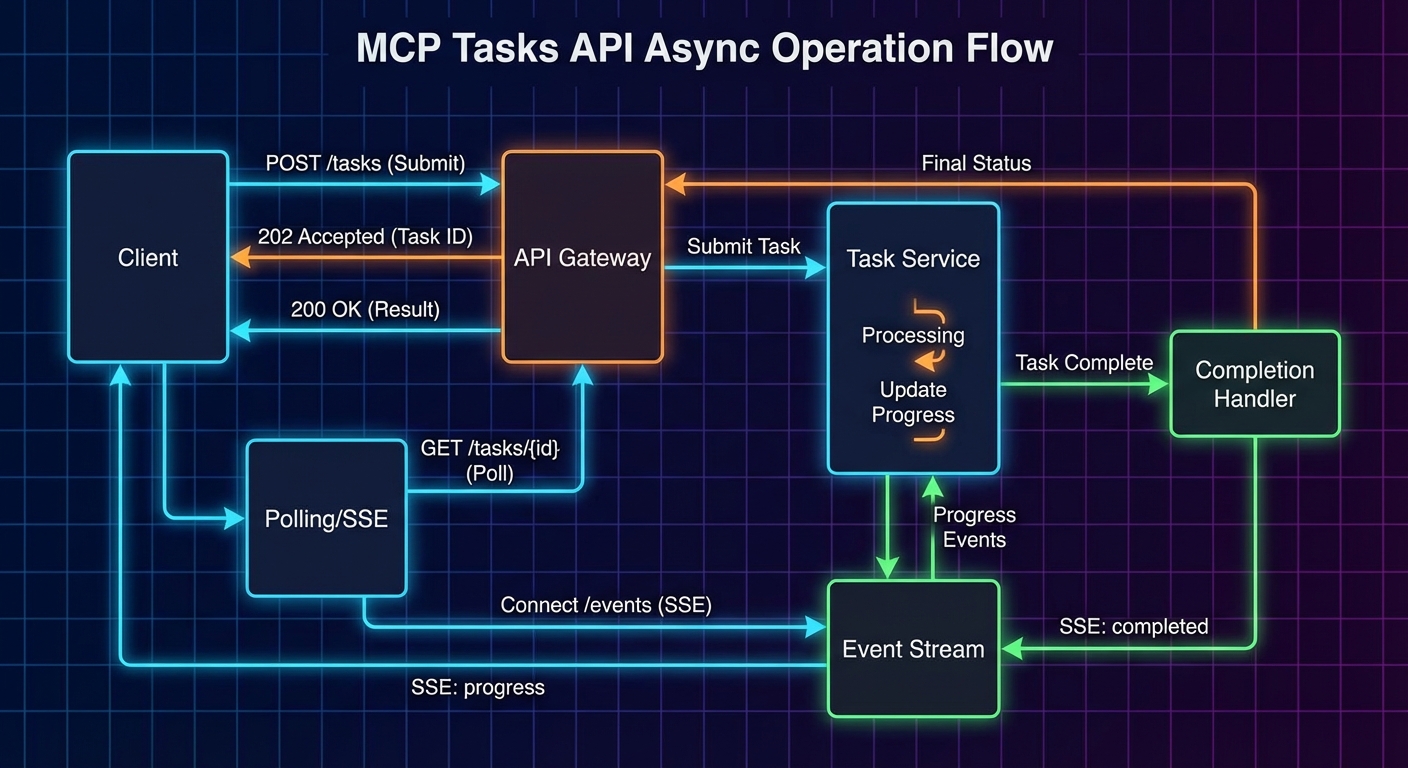
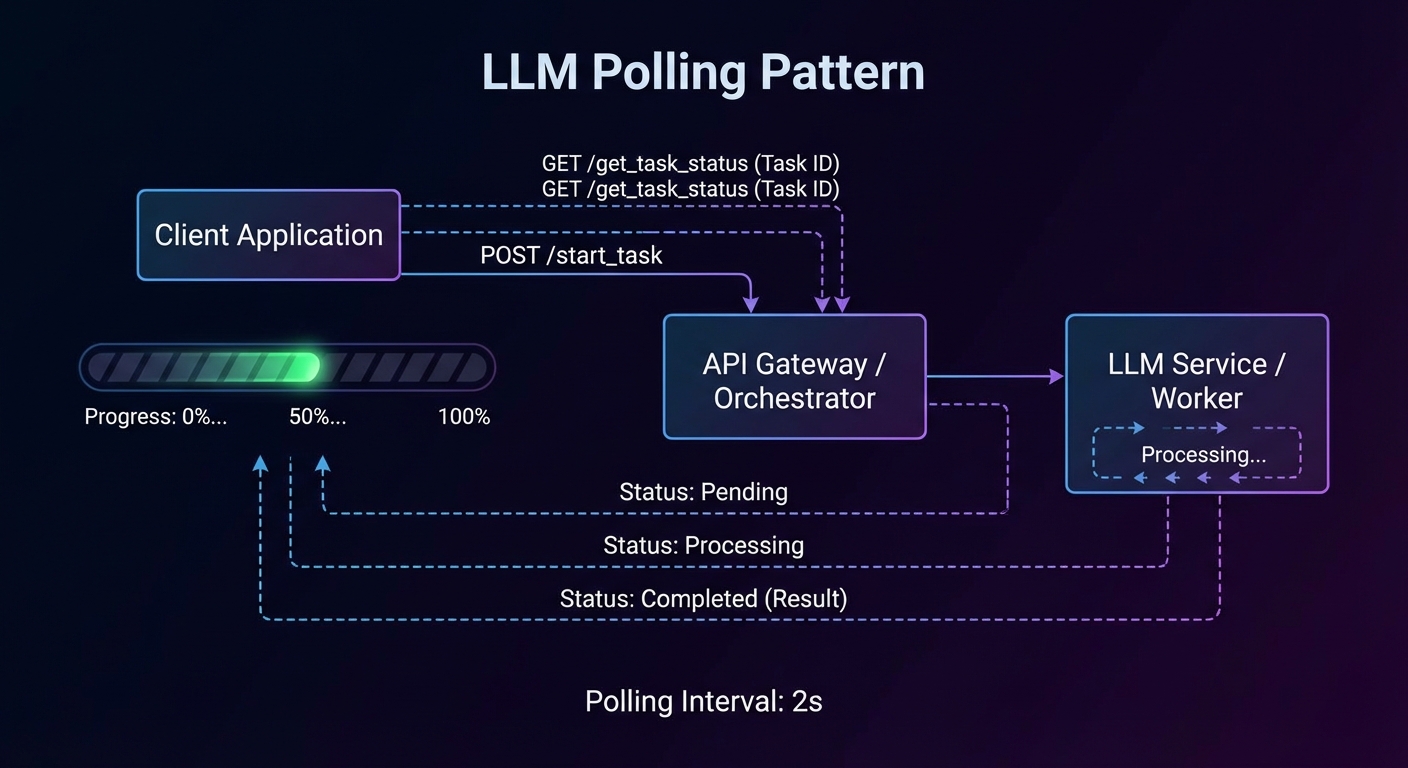
Most MCP tool calls complete in under a second: query a database, call an API, read a file. But some operations take minutes or hours: training a model, processing a large dataset, running a batch export, triggering a CI/CD pipeline. For these, a synchronous request-response model breaks down. The 2025-11-25 specification introduced the Tasks API – a protocol-level mechanism for durable, async request tracking. Instead of inventing your own “start_task + poll get_task_status” pattern (which every server implemented differently), the Tasks API provides a standard state machine, standard polling endpoints (tasks/get, tasks/list, tasks/cancel, tasks/result), and per-tool opt-in via execution.taskSupport.

MCP Tasks API async operation diagram task submitted accepted polling progress events completion dark
Tasks API: augment a tools/call request with a task, poll via tasks/get, retrieve the result via tasks/result when done.

When to Use Tasks vs Regular Tools

  • Use regular tools for operations that complete in under 30 seconds. Keep them synchronous – the LLM waits for the result before proceeding.
  • Use task-augmented tools for operations that take longer than 30 seconds, produce intermediate results the user or LLM can act on, or may fail partway through and need resumability.

Before the Tasks API, every server had to invent its own polling scheme (two tools, custom status fields, ad-hoc cancellation). The protocol-level approach standardises the state machine and the polling endpoints, so every client handles async the same way regardless of which server it talks to.

Task State Machine

Every task starts in the working state and follows a strict lifecycle. The three terminal states (completed, failed, cancelled) are irreversible – once a task reaches one of them, it cannot transition to any other state.

//  Task Status State Machine
//
//  [created] --> working --+--> completed (terminal)
//                 |    ^   +--> failed    (terminal)
//                 |    |   +--> cancelled (terminal)
//                 v    |
//           input_required
//
//  working --> input_required: server needs client input to proceed
//  input_required --> working: client provided the requested input
//  Any non-terminal --> cancelled: via tasks/cancel

The input_required state is for cases where the task cannot proceed without additional input from the client – for example, the server needs an MFA code or the user must approve an intermediate step. When the client sees input_required, it should call tasks/result to receive the pending request (an elicitation or sampling request), handle it, and allow the task to transition back to working.

Capability Negotiation

Both servers and clients declare task support during initialisation. The capabilities structure is organised by request type – a server declares which of its incoming request types (like tools/call) support task augmentation, and a client declares which of its incoming request types (like sampling/createMessage and elicitation/create) support it.

// Server capabilities: tasks supported for tools/call
{
  capabilities: {
    tasks: {
      list: {},                      // supports tasks/list
      cancel: {},                    // supports tasks/cancel
      requests: {
        tools: { call: {} },         // tools/call can be task-augmented
      },
    },
  },
}

// Client capabilities: tasks supported for sampling and elicitation
{
  capabilities: {
    tasks: {
      list: {},
      cancel: {},
      requests: {
        sampling: { createMessage: {} },    // sampling can be task-augmented
        elicitation: { create: {} },        // elicitation can be task-augmented
      },
    },
  },
}

If a server does not include tasks.requests.tools.call, clients MUST NOT attempt task augmentation on that server’s tools, regardless of per-tool settings.

Tool-Level Task Support

Individual tools declare their task support via execution.taskSupport in the tools/list response. This is a fine-grained layer on top of the server-level capability.

// In the tools/list response, each tool can declare task support
{
  name: 'generate_report',
  title: 'Generate Report',
  description: 'Generates a PDF report from analytics data. May take several minutes.',
  inputSchema: { /* ... */ },
  execution: {
    taskSupport: 'optional',   // 'forbidden' (default) | 'optional' | 'required'
  },
}
  • "forbidden" (default): the tool cannot be invoked as a task. If a client tries, the server returns error -32601.
  • "optional": the client may invoke the tool normally (synchronous) or as a task (async). Both work.
  • "required": the client MUST invoke the tool as a task. Synchronous invocation returns error -32601.

Creating a Task-Augmented Request

To invoke a tool as a task, the client includes a task field in the tools/call params. The server accepts the request immediately and returns a CreateTaskResult containing the task metadata – not the actual tool result.

// Client: send a task-augmented tools/call
const response = await client.request({
  method: 'tools/call',
  params: {
    name: 'generate_report',
    arguments: { reportType: 'quarterly', period: '2025-Q3' },
    task: {
      ttl: 300000,   // requested lifetime: 5 minutes
    },
  },
});

// Response is a CreateTaskResult, not the tool result
// {
//   task: {
//     taskId: '786512e2-9e0d-44bd-8f29-789f320fe840',
//     status: 'working',
//     statusMessage: 'Report generation started.',
//     createdAt: '2025-11-25T10:30:00Z',
//     lastUpdatedAt: '2025-11-25T10:30:00Z',
//     ttl: 300000,
//     pollInterval: 5000,
//   }
// }

const { taskId, pollInterval } = response.task;

The ttl (time-to-live in milliseconds) tells the server how long the client wants the task and its results to be retained. The server may override the requested TTL. After the TTL expires, the server may delete the task and its results regardless of status.

Polling With tasks/get

Clients poll for task status using tasks/get. The server returns the current task state including status, statusMessage, and a pollInterval suggestion. Clients SHOULD respect the pollInterval to avoid overwhelming the server.

// Client: poll until terminal status
async function pollTask(client, taskId, initialInterval = 5000) {
  let interval = initialInterval;

  while (true) {
    await new Promise(r => setTimeout(r, interval));

    const status = await client.request({
      method: 'tasks/get',
      params: { taskId },
    });

    console.log(`Task ${taskId}: ${status.status} - ${status.statusMessage ?? ''}`);

    if (['completed', 'failed', 'cancelled'].includes(status.status)) {
      return status;
    }

    if (status.status === 'input_required') {
      // The server needs input - call tasks/result to get the pending request
      return status;
    }

    // Respect the server's suggested poll interval
    if (status.pollInterval) {
      interval = status.pollInterval;
    }
  }
}
Task status polling pattern client calling tasks/get multiple times watching progress working to completed dark
Polling pattern: send task-augmented tools/call, poll with tasks/get respecting pollInterval, retrieve result with tasks/result.

Retrieving Task Results

Once a task reaches a terminal status, the actual tool result is retrieved via tasks/result. This is distinct from tasks/get (which returns task metadata). The result has the same shape as a normal CallToolResult.

// Client: retrieve the actual tool result
const taskStatus = await pollTask(client, taskId);

if (taskStatus.status === 'completed') {
  const result = await client.request({
    method: 'tasks/result',
    params: { taskId },
  });

  // result is a CallToolResult: { content: [...], isError: false }
  console.log('Report ready:', result.content[0].text);
}

if (taskStatus.status === 'failed') {
  const result = await client.request({
    method: 'tasks/result',
    params: { taskId },
  });
  // result may contain an error description
  console.error('Task failed:', result.content?.[0]?.text);
}

If tasks/result is called while the task is still working, the server MUST block until the task reaches a terminal status and then return the result. This makes tasks/result a long-poll alternative to repeated tasks/get calls. However, clients SHOULD still poll with tasks/get in parallel if they want to display progress updates.

Listing and Cancelling Tasks

// List all tasks (paginated)
const listing = await client.request({
  method: 'tasks/list',
  params: { cursor: undefined },  // or a cursor from a previous response
});
// listing.tasks: array of Task objects
// listing.nextCursor: pagination token (if more tasks exist)

// Cancel a running task
try {
  const cancelled = await client.request({
    method: 'tasks/cancel',
    params: { taskId },
  });
  console.log(`Cancelled: ${cancelled.status}`);  // 'cancelled'
} catch (err) {
  // Error -32602 if the task is already in a terminal state
  console.error('Cannot cancel:', err.message);
}

Cancellation transitions the task to the cancelled terminal state. The server SHOULD attempt to stop the underlying work, but the task MUST be marked cancelled even if the underlying computation continues to run (best-effort cancellation). Clients SHOULD NOT rely on cancelled tasks being retained – retrieve any needed data before cancelling.

Status Notifications

Servers MAY send notifications/tasks/status when a task’s status changes. These are a convenience – clients MUST NOT rely on them for correctness, because notifications are optional and may be dropped. Always poll with tasks/get as the source of truth.

// Server: optionally notify the client of status changes
server.notification({
  method: 'notifications/tasks/status',
  params: {
    taskId: '786512e2-...',
    status: 'completed',
    statusMessage: 'Report generation finished.',
    createdAt: '2025-11-25T10:30:00Z',
    lastUpdatedAt: '2025-11-25T10:35:00Z',
    ttl: 300000,
    pollInterval: 5000,
  },
});

Client-Side Tasks: Sampling and Elicitation

Tasks are not server-only. Servers can also send task-augmented requests to the client for sampling/createMessage and elicitation/create. This is useful when a server initiates a sampling request that might take a long time (the client is calling an LLM), or an elicitation that requires the user to complete an out-of-band flow.

The pattern mirrors the server side: the server sends the request with a task field, the client accepts immediately with a CreateTaskResult, and the server polls the client’s tasks/get and tasks/result endpoints. The client declares which request types support this in its capabilities under tasks.requests.sampling.createMessage and tasks.requests.elicitation.create.

Task Metadata: Related Tasks

All requests, notifications, and responses related to a task MUST include io.modelcontextprotocol/related-task in their _meta field. This links sub-operations (like an elicitation triggered during a task-augmented tool call) back to the parent task.

// Elicitation triggered during a task-augmented tool call
// The _meta links it to the parent task
{
  method: 'elicitation/create',
  params: {
    message: 'Enter the MFA code to continue the deployment.',
    requestedSchema: { /* ... */ },
    _meta: {
      'io.modelcontextprotocol/related-task': {
        taskId: '786512e2-9e0d-44bd-8f29-789f320fe840',
      },
    },
  },
}

Server-Side Implementation Pattern

The SDK does not yet have high-level helpers for the Tasks API (it is experimental). In practice, you implement it by managing a task store, intercepting tool calls that include a task field, and exposing the tasks/* methods. Production systems should use Redis or a database so task state survives server restarts.

import crypto from 'node:crypto';

const taskStore = new Map();

// When a tools/call includes params.task, create a task entry and return immediately
function createTask(ttl = 60000) {
  const task = {
    taskId: crypto.randomUUID(),
    status: 'working',
    statusMessage: null,
    createdAt: new Date().toISOString(),
    lastUpdatedAt: new Date().toISOString(),
    ttl,
    pollInterval: 5000,
    _result: null,    // stored when complete
    _error: null,     // stored on failure
  };
  taskStore.set(task.taskId, task);
  return task;
}

function updateTask(taskId, updates) {
  const task = taskStore.get(taskId);
  if (!task) return;
  Object.assign(task, updates, { lastUpdatedAt: new Date().toISOString() });
}

// Clean up expired tasks
setInterval(() => {
  const now = Date.now();
  for (const [id, task] of taskStore) {
    const created = new Date(task.createdAt).getTime();
    if (task.ttl !== null && now - created > task.ttl) {
      taskStore.delete(id);
    }
  }
}, 60_000);

What to Check Right Now

  • Audit your slow tools – any tool that regularly takes over 30 seconds is a candidate for execution.taskSupport: 'optional'.
  • Check server capabilities – if you add task support, declare tasks.requests.tools.call in your server capabilities.
  • Respect pollInterval – never hard-code a polling frequency. Always use the server’s suggested pollInterval from the tasks/get response.
  • Handle all terminal statescompleted, failed, and cancelled all need distinct handling in your polling loop.
  • Remember this is experimental – the Tasks API was introduced in 2025-11-25 and may change. Pin your implementation to the spec version and watch for updates.

nJoy 😉

Lesson 46 of 55: MCP Registry, Discovery, and Service Mesh Patterns

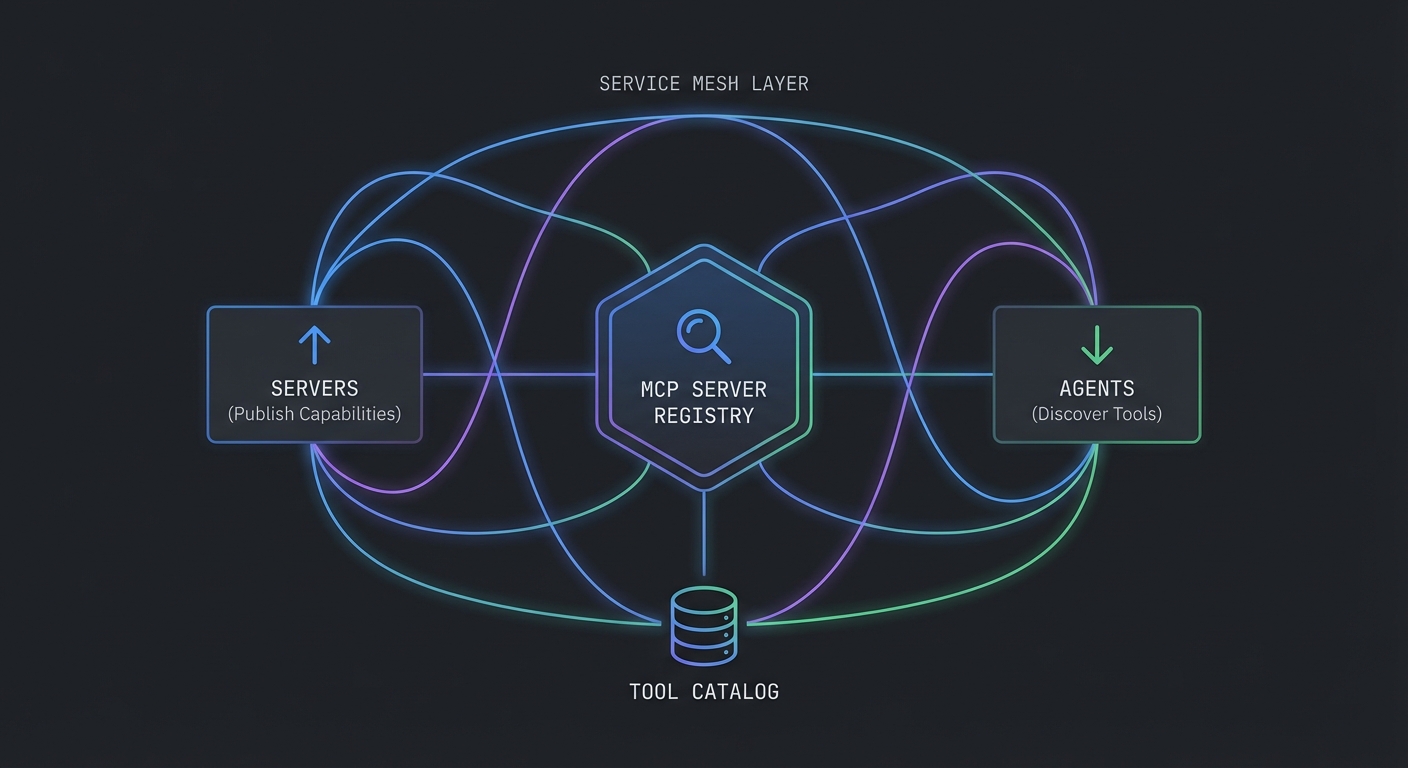
In large organizations, the number of MCP servers grows quickly. A payments MCP server, a customer data MCP server, a product catalog server, an analytics server – each maintained by different teams. Without a registry, every agent developer must manually configure each server’s URL, credentials, and capabilities. A registry solves this: publish once, discover everywhere. This lesson builds an MCP server registry, a discovery client, and covers service mesh integration patterns for enterprise deployments.

MCP server registry diagram servers publishing capabilities agents discovering via registry service mesh dark
MCP registry: servers publish capabilities, agents query the registry to build their tool set dynamically.

Registry Data Model

// A registry entry describes one MCP server
/**
 * @typedef {Object} RegistryEntry
 * @property {string} id - Unique server identifier (slug)
 * @property {string} name - Human-readable name
 * @property {string} description - What this server does
 * @property {string} url - Base URL for Streamable HTTP transport
 * @property {string} version - Server version (semver)
 * @property {string[]} tags - Capability tags for discovery (e.g., ['products', 'inventory'])
 * @property {Object} auth - Authentication requirements
 * @property {string} auth.type - 'none' | 'bearer' | 'oauth2'
 * @property {string} [auth.tokenEndpoint] - OAuth token endpoint if auth.type === 'oauth2'
 * @property {string} healthUrl - Health check endpoint
 * @property {Date} lastSeen - Last successful health check
 * @property {'healthy' | 'degraded' | 'down'} status - Current health status
 */

A shared schema keeps every team describing servers the same way: URL and version for routing upgrades, tags for capability search, and auth metadata so hosts know whether to attach a bearer token or run an OAuth flow. healthUrl and lastSeen let the registry drop or deprioritize dead endpoints before agents waste time connecting.

Simple Registry Server

// registry-server.js - A lightweight HTTP registry for MCP servers
import express from 'express';

const app = express();
app.use(express.json());

// In-memory store (use Redis or PostgreSQL in production)
const registry = new Map();

// Register a server
app.post('/servers', (req, res) => {
  const entry = {
    ...req.body,
    registeredAt: new Date().toISOString(),
    lastSeen: new Date().toISOString(),
    status: 'healthy',
  };
  registry.set(entry.id, entry);
  res.status(201).json({ id: entry.id });
});

// List all healthy servers (with optional tag filter)
app.get('/servers', (req, res) => {
  const { tags, status = 'healthy' } = req.query;
  let servers = [...registry.values()].filter(s => s.status === status);

  if (tags) {
    const filterTags = tags.split(',');
    servers = servers.filter(s => filterTags.some(t => s.tags?.includes(t)));
  }

  res.json({ servers });
});

// Health check runner: poll all registered servers every 30 seconds
setInterval(async () => {
  for (const [id, entry] of registry) {
    try {
      const res = await fetch(entry.healthUrl, { signal: AbortSignal.timeout(5000) });
      entry.status = res.ok ? 'healthy' : 'degraded';
      entry.lastSeen = new Date().toISOString();
    } catch {
      entry.status = 'down';
    }
    registry.set(id, entry);
  }
}, 30_000);

app.listen(4000, () => console.log('Registry listening on :4000'));

The in-memory Map is enough to learn the flow; in a real project, you would persist entries in PostgreSQL or Redis, authenticate POST /servers so only CI or cluster identity can register, and run the health poller as a separate worker or cron so API latency stays predictable under many servers.

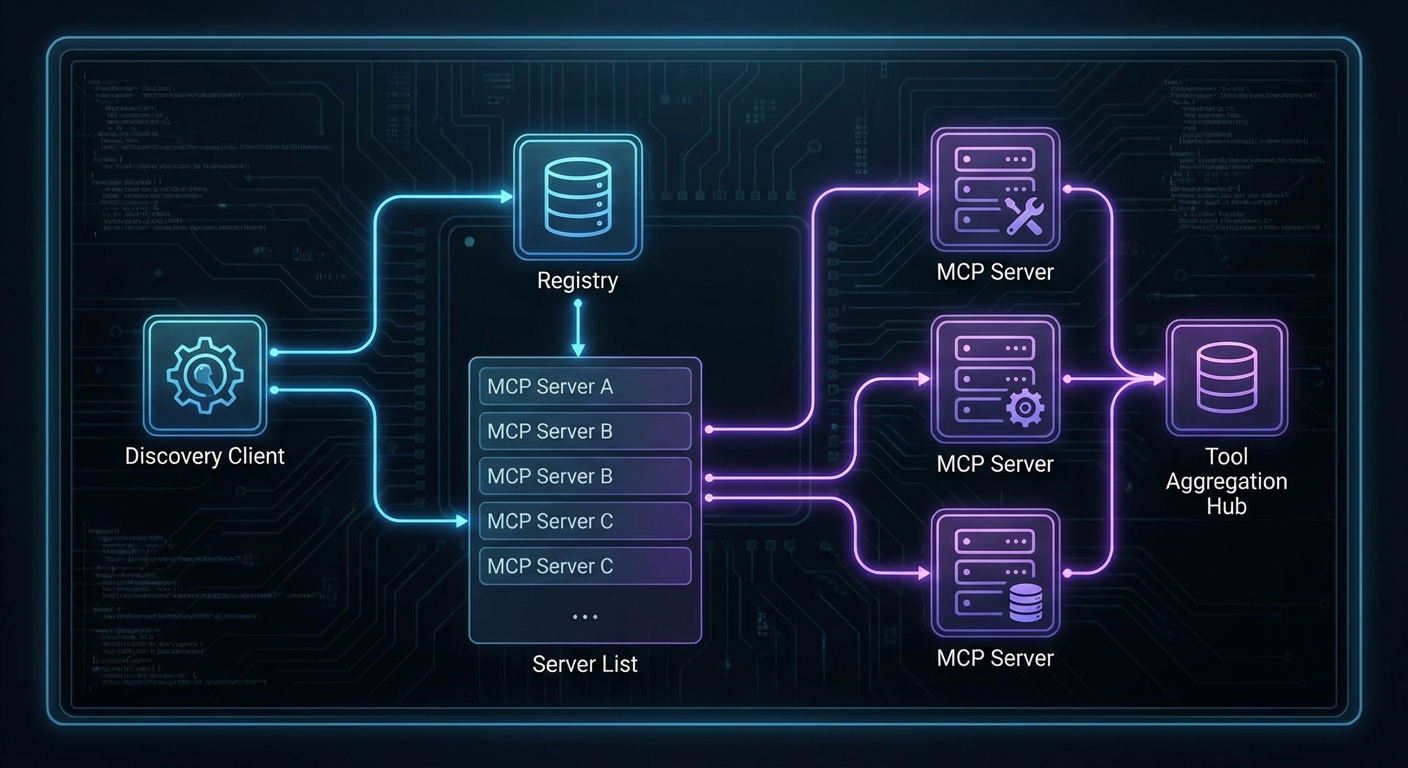
Discovery Client for Agents

The discovery client connects to servers found in the registry, lists their tools once, builds an index, and routes tool calls to the correct server without repeating the listTools() round trip on every invocation.

// discovery-client.js - Used by agent hosts to discover MCP servers
import { Client } from '@modelcontextprotocol/sdk/client/index.js';
import { StreamableHTTPClientTransport } from '@modelcontextprotocol/sdk/client/streamable-http.js';

class McpDiscoveryClient {
  #registryUrl;
  #connections = new Map();   // serverId -> { client, server }
  #toolIndex = new Map();     // toolName -> client (built once, refreshed on change)

  constructor(registryUrl) {
    this.#registryUrl = registryUrl;
  }

  // Discover servers by tags, connect, and build the tool index
  async connect(tags = []) {
    const query = tags.length ? `?tags=${tags.join(',')}` : '';
    const res = await fetch(`${this.#registryUrl}/servers${query}`);
    const { servers } = await res.json();

    const connected = [];
    for (const server of servers) {
      if (this.#connections.has(server.id)) {
        connected.push(server);
        continue;
      }

      try {
        const transport = new StreamableHTTPClientTransport(new URL(`${server.url}/mcp`));
        const client = new Client({ name: 'discovery-host', version: '1.0.0' });
        await client.connect(transport);

        // Listen for tool list changes so the index stays current
        client.setNotificationHandler(
          { method: 'notifications/tools/list_changed' },
          async () => { await this.#rebuildIndex(); }
        );

        this.#connections.set(server.id, { client, server });
        connected.push(server);
        console.log(`Connected to ${server.name} (${server.id})`);
      } catch (err) {
        console.error(`Failed to connect to ${server.name}: ${err.message}`);
      }
    }

    // Build the tool index once after all connections are established
    await this.#rebuildIndex();
    return connected;
  }

  // Build a Map<toolName, client> from all connected servers
  // Called once on connect() and again if any server signals tools/list_changed
  async #rebuildIndex() {
    this.#toolIndex.clear();
    for (const [id, { client }] of this.#connections) {
      try {
        const { tools } = await client.listTools();
        for (const tool of tools) {
          this.#toolIndex.set(tool.name, client);
        }
      } catch (err) {
        console.error(`Failed to index tools from ${id}: ${err.message}`);
      }
    }
    console.log(`Tool index rebuilt: ${this.#toolIndex.size} tools across ${this.#connections.size} servers`);
  }

  // Get all tools from all connected servers (uses cached index)
  async getAllTools() {
    const allTools = [];
    for (const [id, { client }] of this.#connections) {
      try {
        const { tools } = await client.listTools();
        allTools.push(...tools.map(t => ({ ...t, serverId: id })));
      } catch (err) {
        console.error(`Failed to list tools from ${id}: ${err.message}`);
      }
    }
    return allTools;
  }

  // Route a tool call to the correct server via the pre-built index
  // No listTools() round trip on each call - O(1) lookup
  async callTool(toolName, args) {
    const client = this.#toolIndex.get(toolName);
    if (!client) {
      throw new Error(`Tool '${toolName}' not found in any connected server`);
    }
    return client.callTool({ name: toolName, arguments: args });
  }
}

// Usage
const discovery = new McpDiscoveryClient('https://registry.internal');
await discovery.connect(['products', 'analytics']);
const allTools = await discovery.getAllTools();
console.log(`Discovered ${allTools.length} tools across all servers`);

// Tool calls now use the index - no extra round trip
const result = await discovery.callTool('search_products', { query: 'laptop', limit: 5 });

The previous version of this code called listTools() on every server on every callTool() invocation – a quadratic round-trip cost that gets expensive fast. The index is built once and refreshed automatically when a server emits notifications/tools/list_changed.

Discovery client connecting to registry fetching server list connecting to multiple MCP servers aggregating tools dark
Discovery flow: query registry by tags -> connect to relevant servers -> aggregate tools -> route calls.

Service Mesh Integration (Istio / Linkerd)

In Kubernetes environments, a service mesh handles mutual TLS, traffic routing, and observability for all service-to-service communication, including MCP connections:

# With Istio, MCP server-to-server communication is automatically mTLS
# No code changes required - the sidecar proxy handles it

# Example: VirtualService for traffic splitting during MCP server rollout
apiVersion: networking.istio.io/v1alpha3
kind: VirtualService
metadata:
  name: mcp-product-server
spec:
  hosts:
    - mcp-product-server
  http:
    - route:
        - destination:
            host: mcp-product-server
            subset: v2
          weight: 10  # 10% to new version
        - destination:
            host: mcp-product-server
            subset: v1
          weight: 90  # 90% to stable version

Weighted routes let you canary a new MCP build while most sessions stay on the known-good subset. In a real project, you would pair this with metric and trace dashboards so a spike in tool errors on the new subset triggers an automatic rollback or traffic shift.

Server Health Aggregation

// Aggregate health status across all registered servers for a status page
app.get('/status', async (req, res) => {
  const servers = [...registry.values()];
  const healthy = servers.filter(s => s.status === 'healthy').length;
  const degraded = servers.filter(s => s.status === 'degraded').length;
  const down = servers.filter(s => s.status === 'down').length;

  const overall = down > 0 ? 'degraded' : (degraded > 0 ? 'degraded' : 'operational');

  res.json({
    status: overall,
    summary: { total: servers.length, healthy, degraded, down },
    servers: servers.map(s => ({
      id: s.id, name: s.name, status: s.status, lastSeen: s.lastSeen,
    })),
  });
});

A single /status response gives operators and internal portals a fleet-wide view without opening each MCP server. In a real project, you would cache or rate-limit heavy dashboards and map down servers to paging rules so on-call sees registry-level outages, not only per-pod alerts.

What to Build Next

  • Deploy the registry server alongside your existing MCP servers. Register each server on startup using a POST to the registry.
  • Build a simple status page that reads from /status and shows which MCP servers are healthy.

nJoy 😉

Lesson 45 of 55: CI/CD for MCP Servers – Tests, Versioning, Zero-Downtime Deploys

An MCP server that works in development can break in production in subtle ways: a tool’s Zod schema changes and clients that cached the old schema break; a new tool is added and existing clients need to discover it; a bug fix changes a tool’s output format and downstream agents that parse it stop working. This lesson covers the testing strategy, versioning approach, and CI/CD pipeline that makes MCP server deployments safe and repeatable.

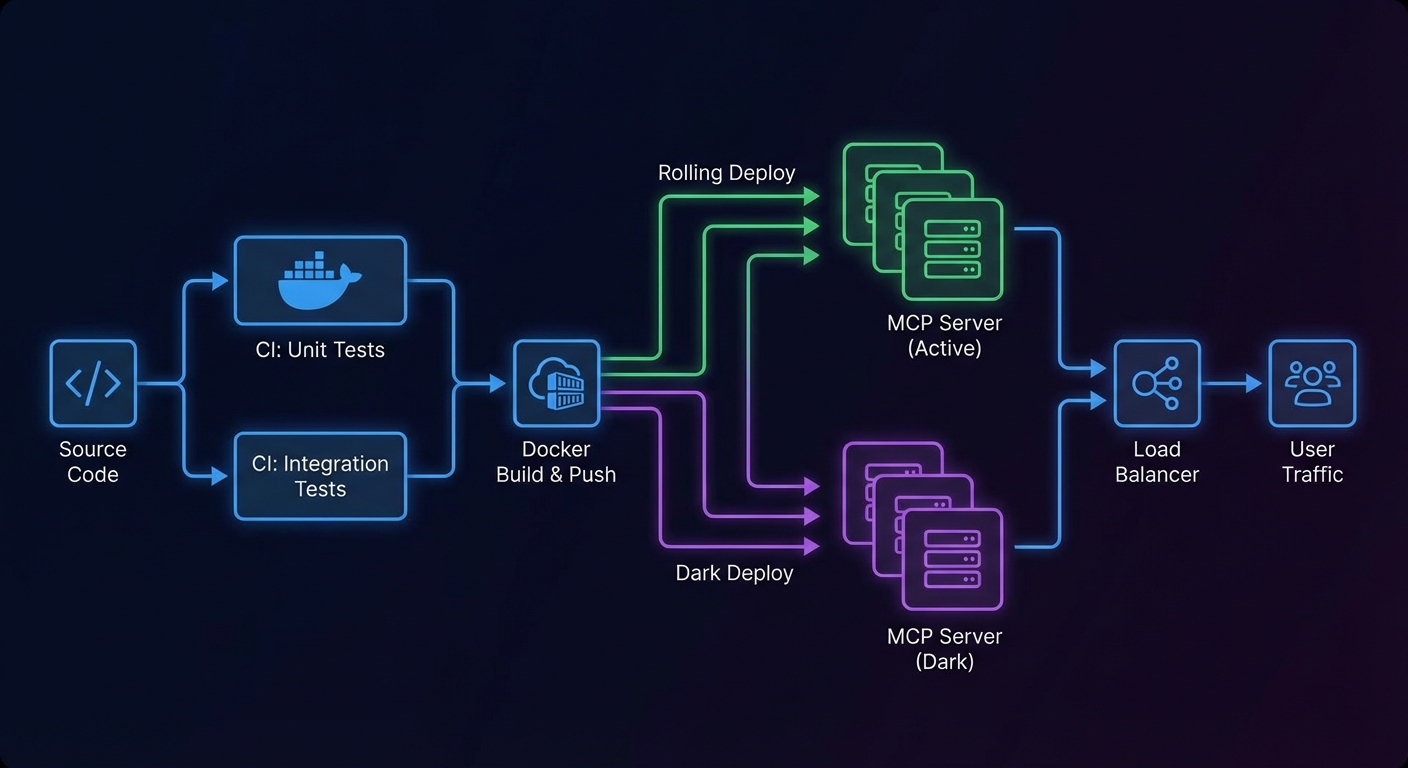
CI/CD pipeline for MCP server showing test stages build Docker push deploy rolling update dark diagram
MCP CI/CD: unit tests -> integration tests against a real MCP server -> build -> push -> rolling deploy.

Testing Strategy for MCP Servers

Unit Tests: Tool Handlers in Isolation

// test/tools/search-products.test.js
import { test, describe, mock } from 'node:test';
import assert from 'node:assert';
import { searchProductsHandler } from '../../tools/search-products.js';

describe('searchProductsHandler', () => {
  test('returns products matching query', async () => {
    const mockDb = {
      query: mock.fn(async () => ({ rows: [{ id: 1, name: 'Laptop X1', price: 999 }] })),
    };

    const result = await searchProductsHandler({ query: 'laptop', limit: 10 }, { db: mockDb });

    assert.ok(!result.isError);
    assert.ok(result.content[0].text.includes('Laptop X1'));
    assert.strictEqual(mockDb.query.mock.calls.length, 1);
  });

  test('returns error on empty query', async () => {
    const result = await searchProductsHandler({ query: '', limit: 10 }, {});
    assert.ok(result.isError);
  });
});

Unit testing tool handlers in isolation catches the majority of bugs before they ever reach a live server. By mocking the database and other dependencies, you can run hundreds of these tests in under a second. The real value shows up during refactoring: when you change a handler’s internals, these tests immediately confirm whether the output contract still holds.

Integration Tests: Full MCP Client-Server Round Trip

Unit tests verify logic, but they cannot catch problems in the MCP wire protocol, Zod schema serialization, or transport setup. Integration tests spin up the actual server as a subprocess and talk to it through a real MCP client, exercising the full request-response lifecycle.

// test/integration/mcp-server.test.js
import { test, describe, before, after } from 'node:test';
import assert from 'node:assert';
import { Client } from '@modelcontextprotocol/sdk/client/index.js';
import { StdioClientTransport } from '@modelcontextprotocol/sdk/client/stdio.js';

let client;
let transport;

before(async () => {
  transport = new StdioClientTransport({
    command: 'node',
    args: ['src/server.js'],
    env: { ...process.env, DATABASE_URL: process.env.TEST_DATABASE_URL },
  });
  client = new Client({ name: 'test-client', version: '1.0.0' });
  await client.connect(transport);
});

after(async () => {
  await client.close();
});

describe('MCP server integration', () => {
  test('lists expected tools', async () => {
    const { tools } = await client.listTools();
    const toolNames = tools.map(t => t.name);
    assert.ok(toolNames.includes('search_products'), 'search_products tool missing');
    assert.ok(toolNames.includes('get_product'), 'get_product tool missing');
  });

  test('search_products returns results', async () => {
    const result = await client.callTool({
      name: 'search_products',
      arguments: { query: 'laptop', limit: 5 },
    });
    assert.ok(!result.isError);
    const parsed = JSON.parse(result.content[0].text);
    assert.ok(Array.isArray(parsed));
  });

  test('get_product returns 404 error for unknown id', async () => {
    const result = await client.callTool({
      name: 'get_product',
      arguments: { id: 'nonexistent-99999' },
    });
    assert.ok(result.isError);
    assert.ok(result.content[0].text.includes('not found'));
  });
});
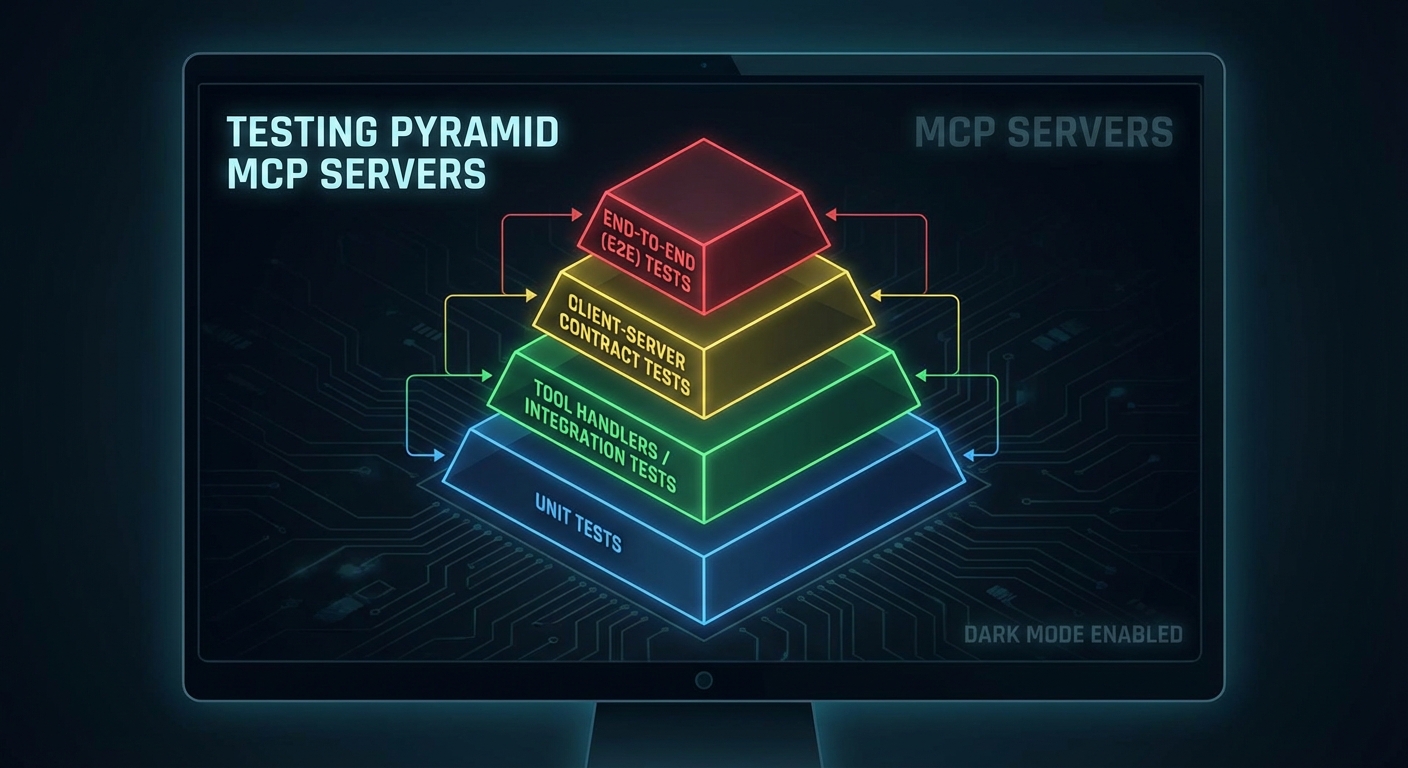
Testing pyramid for MCP servers unit handlers integration client-server contract tests e2e dark diagram
Testing pyramid: unit tests for handlers, integration tests for the full MCP round trip, e2e for business flows.

Protocol Versioning

Testing tells you whether the current build works. Versioning tells clients whether they are compatible with it. Since MCP clients often cache tool schemas, a server upgrade that changes a tool’s input shape can silently break agents that are still using the old schema. Exposing version metadata lets clients detect incompatibilities before they become runtime errors.

// server.js - declare server version in metadata
const server = new McpServer({
  name: 'product-server',
  version: process.env.npm_package_version ?? '1.0.0',
});

// Add a version resource so clients can check compatibility
// server.resource(name, uri, handler) - the URI is the second argument
server.resource(
  'server-version',           // resource name (identifier)
  'server://version',         // resource URI (what clients request)
  async (uri) => ({
    contents: [{
      uri: uri.href,
      mimeType: 'application/json',
      text: JSON.stringify({
        serverVersion: process.env.npm_package_version,
        mcpProtocolVersion: '2025-11-25',
        minimumClientVersion: '1.0.0',
        breaking_changes: [],
      }),
    }],
  })
);

GitHub Actions CI Pipeline

With tests and versioning in place, the CI pipeline ties everything together. The workflow below runs unit and integration tests against a real PostgreSQL service container, then builds a Docker image and deploys via rolling update. A failing test blocks the entire pipeline, so broken code never reaches production.

name: MCP Server CI/CD

on:
  push:
    branches: [main]
  pull_request:
    branches: [main]

jobs:
  test:
    runs-on: ubuntu-latest
    services:
      postgres:
        image: postgres:16
        env:
          POSTGRES_DB: mcp_test
          POSTGRES_USER: postgres
          POSTGRES_PASSWORD: testpass
        ports:
          - 5432:5432
    steps:
      - uses: actions/checkout@v4
      - uses: actions/setup-node@v4
        with:
          node-version: '22'
          cache: 'npm'
      - run: npm ci
      - run: npm test
        env:
          TEST_DATABASE_URL: postgresql://postgres:testpass@localhost:5432/mcp_test

  build-and-push:
    needs: test
    if: github.ref == 'refs/heads/main'
    runs-on: ubuntu-latest
    steps:
      - uses: actions/checkout@v4
      - uses: docker/setup-buildx-action@v3
      - uses: docker/login-action@v3
        with:
          registry: ghcr.io
          username: ${{ github.actor }}
          password: ${{ secrets.GITHUB_TOKEN }}
      - uses: docker/build-push-action@v5
        with:
          push: true
          tags: ghcr.io/${{ github.repository }}:${{ github.sha }},ghcr.io/${{ github.repository }}:latest
          cache-from: type=gha
          cache-to: type=gha,mode=max

  deploy:
    needs: build-and-push
    runs-on: ubuntu-latest
    steps:
      - name: Deploy to production
        run: |
          ssh deploy@production "
            docker pull ghcr.io/${{ github.repository }}:${{ github.sha }} &&
            docker service update --image ghcr.io/${{ github.repository }}:${{ github.sha }} mcp-product-server
          "

Zero-Downtime Deployment with Docker Swarm

The most dangerous moment in an MCP server’s lifecycle is deployment. Active SSE connections are stateful, so killing all instances simultaneously drops every connected client. A rolling update replaces one instance at a time and waits for health checks to pass before moving to the next. If a new build fails its health check, the --update-failure-action rollback flag automatically reverts to the previous image.

# Rolling update: replace instances one at a time, wait for health checks
docker service update \
  --image ghcr.io/myorg/mcp-product-server:v1.3.0 \
  --update-parallelism 1 \
  --update-delay 10s \
  --update-failure-action rollback \
  --health-cmd "wget -qO- http://localhost:3000/health || exit 1" \
  --health-interval 10s \
  --health-retries 3 \
  mcp-product-server

What to Build Next

  • Write integration tests for your top 3 most-used tools using the client-server pattern above. Run them with node --test.
  • Add the GitHub Actions pipeline from this lesson to your MCP server repo. Verify that a failing test blocks the build.

nJoy 😉

Lesson 44 of 55: MCP Observability – Logs, Prometheus Metrics, OpenTelemetry Traces

You cannot fix what you cannot measure. MCP applications introduce new failure surfaces: tool latency, LLM token costs per request, session counts, tool call error rates, and the latency contribution of each component in a multi-step agent run. This lesson builds the observability stack for an MCP server: structured logging with correlation IDs, Prometheus metrics, and OpenTelemetry distributed tracing that shows the full span from user request to final LLM response.

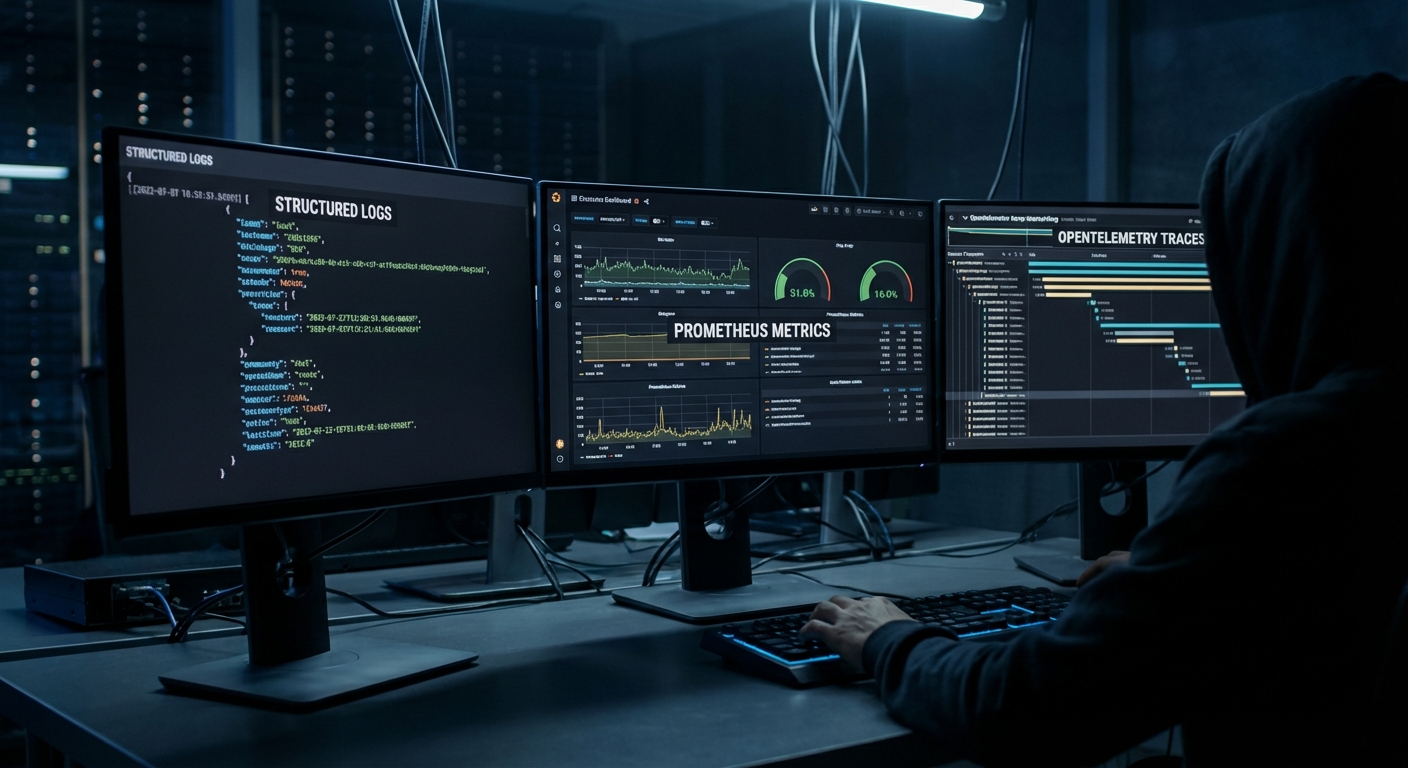
MCP observability stack diagram showing logs metrics traces flowing to dashboards Prometheus Grafana OpenTelemetry dark
Three pillars of MCP observability: structured logs, Prometheus metrics, and OpenTelemetry traces.

Structured Logging with Correlation IDs

// Every log line includes a correlation ID that spans the full request lifecycle
import crypto from 'node:crypto';

class Logger {
  #context;

  constructor(context = {}) {
    this.#context = context;
  }

  child(context) {
    return new Logger({ ...this.#context, ...context });
  }

  #log(level, message, extra = {}) {
    process.stdout.write(JSON.stringify({
      timestamp: new Date().toISOString(),
      level,
      message,
      ...this.#context,
      ...extra,
    }) + '\n');
  }

  info(msg, extra) { this.#log('info', msg, extra); }
  warn(msg, extra) { this.#log('warn', msg, extra); }
  error(msg, extra) { this.#log('error', msg, extra); }
}

const rootLogger = new Logger({ service: 'mcp-server', version: '1.0.0' });

// Per-request logger with correlation ID
app.use((req, res, next) => {
  const requestId = req.headers['x-request-id'] ?? crypto.randomUUID();
  req.log = rootLogger.child({ requestId, path: req.path, method: req.method });
  res.setHeader('x-request-id', requestId);
  req.log.info('Request received');
  next();
});

Plain console logs are hard to grep at volume and impossible to stitch across services. JSON lines with a stable requestId let you jump from one error line to the full story in log aggregators and prove which user or agent session triggered a spike in tool errors.

Prometheus Metrics

npm install prom-client
import { Registry, Counter, Histogram, Gauge } from 'prom-client';

const registry = new Registry();

// Tool call metrics
const toolCallTotal = new Counter({
  name: 'mcp_tool_calls_total',
  help: 'Total number of MCP tool calls',
  labelNames: ['tool_name', 'status'],
  registers: [registry],
});

const toolCallDuration = new Histogram({
  name: 'mcp_tool_call_duration_seconds',
  help: 'Duration of MCP tool calls in seconds',
  labelNames: ['tool_name'],
  buckets: [0.01, 0.05, 0.1, 0.5, 1, 5, 10, 30],
  registers: [registry],
});

const activeSessions = new Gauge({
  name: 'mcp_active_sessions',
  help: 'Number of active MCP sessions',
  registers: [registry],
});

const llmTokensTotal = new Counter({
  name: 'mcp_llm_tokens_total',
  help: 'Total LLM tokens consumed',
  labelNames: ['provider', 'model', 'type'],
  registers: [registry],
});

// Expose /metrics endpoint for Prometheus scraping
app.get('/metrics', async (req, res) => {
  res.setHeader('Content-Type', registry.contentType);
  res.end(await registry.metrics());
});

// Instrument tool calls
function instrumentedToolCall(name, handler) {
  return async (args, context) => {
    const end = toolCallDuration.startTimer({ tool_name: name });
    try {
      const result = await handler(args, context);
      const status = result?.isError ? 'error' : 'success';
      toolCallTotal.inc({ tool_name: name, status });
      return result;
    } catch (err) {
      toolCallTotal.inc({ tool_name: name, status: 'exception' });
      throw err;
    } finally {
      end();
    }
  };
}

Counters and histograms turn noisy tool traffic into SLO-friendly views: which tools fail, how slow p95 is, and whether sessions or token burn are climbing. In a real project, you would wrap each registered tool with instrumentedToolCall (or equivalent) so every path records latency and outcome without hand-maintained log parsing.

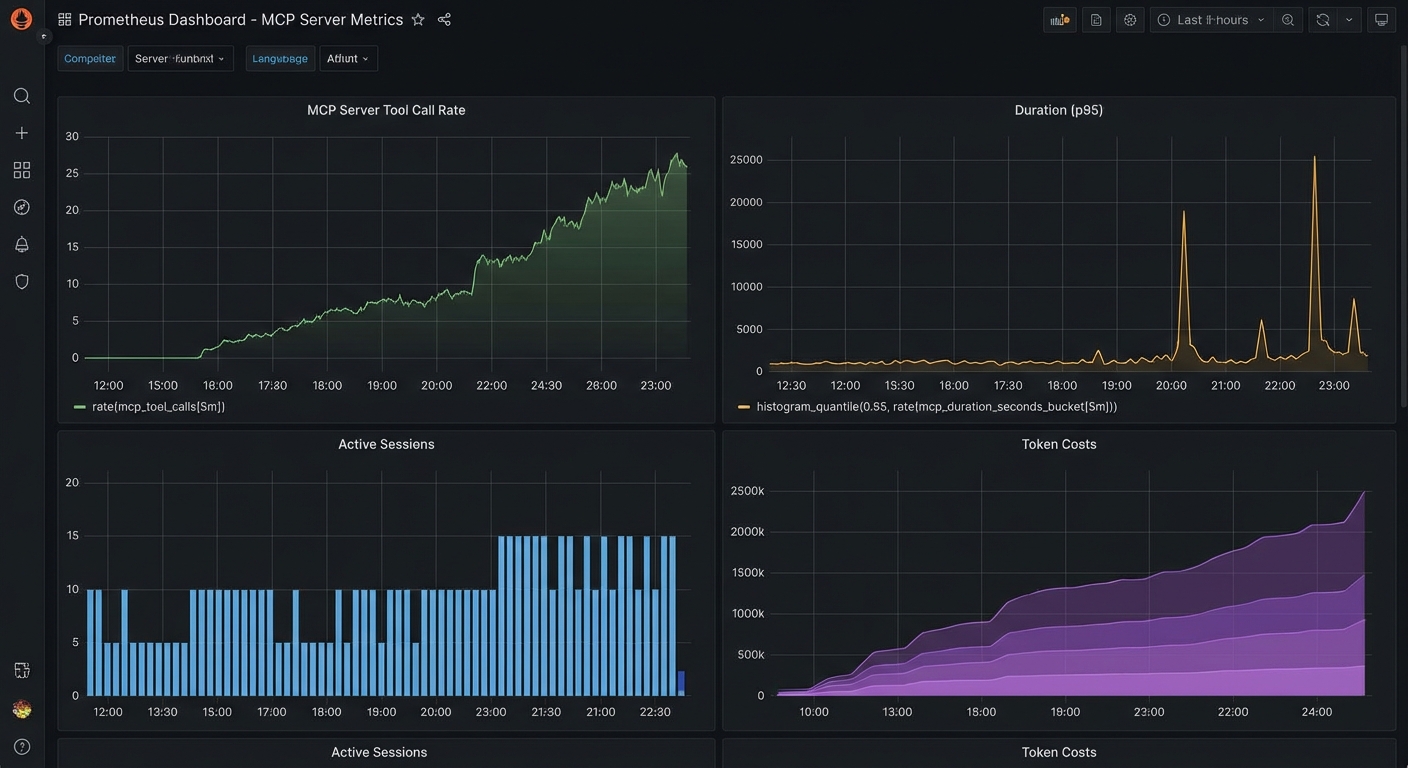
Prometheus metrics dashboard for MCP server showing tool call rate duration active sessions token costs dark
Key MCP metrics to track: tool call rate per tool, p95 latency, active sessions, and token costs per provider.

OpenTelemetry Distributed Tracing

npm install @opentelemetry/sdk-node @opentelemetry/auto-instrumentations-node \
            @opentelemetry/exporter-trace-otlp-http
// tracing.js - Load this BEFORE any other imports
import { NodeSDK } from '@opentelemetry/sdk-node';
import { OTLPTraceExporter } from '@opentelemetry/exporter-trace-otlp-http';
import { getNodeAutoInstrumentations } from '@opentelemetry/auto-instrumentations-node';

const sdk = new NodeSDK({
  traceExporter: new OTLPTraceExporter({
    url: process.env.OTEL_EXPORTER_OTLP_ENDPOINT ?? 'http://localhost:4318/v1/traces',
  }),
  instrumentations: [getNodeAutoInstrumentations()],
  serviceName: 'mcp-server',
  serviceVersion: process.env.npm_package_version,
});

sdk.start();
process.on('SIGTERM', () => sdk.shutdown());

Auto-instrumentation captures HTTP and many libraries with little code, but the SDK must start before other modules load or spans will be incomplete. Point OTEL_EXPORTER_OTLP_ENDPOINT at your collector (Grafana Agent, Datadog Agent, vendor OTLP ingress) so traces leave the pod with the same labels you use for metrics.

// Add custom spans for MCP tool calls
import { trace, SpanStatusCode } from '@opentelemetry/api';

const tracer = trace.getTracer('mcp-server');

function tracedToolCall(name, handler) {
  return async (args, context) => {
    return tracer.startActiveSpan(`mcp.tool.${name}`, async (span) => {
      span.setAttributes({
        'mcp.tool.name': name,
        'mcp.session.id': context.sessionId ?? 'unknown',
        'mcp.arg.keys': JSON.stringify(Object.keys(args)),
      });

      try {
        const result = await handler(args, context);
        span.setStatus({ code: result?.isError ? SpanStatusCode.ERROR : SpanStatusCode.OK });
        return result;
      } catch (err) {
        span.recordException(err);
        span.setStatus({ code: SpanStatusCode.ERROR, message: err.message });
        throw err;
      } finally {
        span.end();
      }
    });
  };
}

Custom spans make the MCP layer visible inside a trace: you see tool name, session, and failure mode next to downstream HTTP or DB spans. That closes the loop when metrics show latency but logs do not say which hop grew; the following queries turn the same series into boards and on-call dashboards.

Grafana Dashboard Queries

# Top 5 slowest tools (p95 latency)
histogram_quantile(0.95, sum(rate(mcp_tool_call_duration_seconds_bucket[5m])) by (le, tool_name))

# Tool error rate
sum(rate(mcp_tool_calls_total{status="error"}[5m])) by (tool_name)
/
sum(rate(mcp_tool_calls_total[5m])) by (tool_name)

# Token cost per hour (estimated)
sum(increase(mcp_llm_tokens_total{type="input"}[1h])) by (model) * 0.0000025

# Active sessions over time
mcp_active_sessions

OpenTelemetry Trace Context in MCP

New in Draft – This convention is documented in the Draft spec and may be finalised in a future revision.

The Draft specification documents a standard convention for propagating OpenTelemetry trace context through MCP messages. Any request or notification can include traceparent, tracestate, and baggage keys in the _meta field, following the W3C Trace Context format. This lets traces flow seamlessly from an MCP client through the server and into downstream services (databases, APIs, queues) without custom propagation code.

// Client: include OTel trace context in an MCP request
const response = await client.request({
  method: 'tools/call',
  params: {
    name: 'query_database',
    arguments: { sql: 'SELECT * FROM orders LIMIT 10' },
    _meta: {
      traceparent: '00-4bf92f3577b34da6a3ce929d0e0e4736-00f067aa0ba902b7-01',
      tracestate: 'vendor=mycompany',
      baggage: 'userId=alice,tenant=acme',
    },
  },
});

// Server: extract trace context from _meta and create a child span
function handleToolCall(params) {
  const { traceparent, tracestate, baggage } = params._meta ?? {};

  // Use the W3C propagator to create a context from the incoming headers
  const parentContext = propagation.extract(ROOT_CONTEXT, {
    traceparent,
    tracestate,
    baggage,
  });

  return tracer.startActiveSpan('mcp.tools/call', { attributes: {
    'mcp.tool.name': params.name,
  }}, parentContext, async (span) => {
    try {
      const result = await executeToolHandler(params);
      span.setStatus({ code: SpanStatusCode.OK });
      return result;
    } finally {
      span.end();
    }
  });
}

With this convention, a single trace can show the full journey: user action in the host, MCP client request, server tool execution, database query, and back. This is essential for debugging latency in production MCP deployments where the bottleneck could be anywhere in the chain.

Key Alerts to Configure

  • Tool error rate > 5% for 5 minutes: A specific tool may be failing due to a backend outage or schema change
  • p95 tool latency > 10 seconds for 5 minutes: A tool is consistently slow – investigate the backend
  • Active sessions > 1000: Approaching capacity – scale up or investigate for session leaks
  • LLM token rate > 2x baseline: Possible runaway agent loop – investigate with trace data

nJoy 😉

Lesson 42 of 55: Scaling MCP – Load Balancing, Rate Limiting, and Caching

A single MCP server instance handling one user works fine. The same server handling 500 concurrent users during peak hours is a different problem entirely. This lesson covers the four levers for scaling MCP infrastructure: horizontal scaling with session affinity, rate limiting that protects both your server and upstream LLM APIs, response caching for expensive tool calls, and load balancing configurations that handle MCP’s stateful session requirements correctly.

MCP scaling architecture diagram load balancer multiple server instances Redis session cache rate limiter dark
Horizontal MCP scaling requires: session affinity, shared session store, and a rate limiter at the gateway.

Horizontal Scaling with Shared Session State

MCP Streamable HTTP sessions are stateful. If a client’s POST goes to server A but the next SSE connection goes to server B, the session state is lost. Two solutions:

Option 1: Sticky sessions (simpler) – Configure your load balancer to route all requests from the same client to the same server instance. Works but creates uneven load distribution.

Option 2: Shared session store (recommended) – Store session state in Redis and allow any server instance to handle any request.

import { createClient } from 'redis';
import { McpServer } from '@modelcontextprotocol/sdk/server/mcp.js';
import { StreamableHTTPServerTransport } from '@modelcontextprotocol/sdk/server/streamable-http.js';

const redis = createClient({ url: process.env.REDIS_URL });
await redis.connect();

// In-memory session store backed by Redis
const sessions = new Map();  // Local cache for active requests

app.post('/mcp', async (req, res) => {
  const sessionId = req.headers['mcp-session-id'];

  // Try local cache first, then Redis
  let transport = sessions.get(sessionId);
  if (!transport && sessionId) {
    const stored = await redis.get(`mcp:session:${sessionId}`);
    if (stored) {
      // Restore session - in practice, transport state is complex to serialize
      // For true multi-instance support, use sticky sessions at the LB level
      console.error(`Session ${sessionId} not found locally - sticky sessions recommended`);
    }
  }

  if (!transport) {
    transport = new StreamableHTTPServerTransport({
      sessionIdGenerator: () => crypto.randomUUID(),
      onsessioninitialized: async (sid) => {
        sessions.set(sid, transport);
        // Mark session as active in Redis (for health tracking)
        await redis.setEx(`mcp:session:${sid}:active`, 3600, '1');
      },
    });
    const server = buildMcpServer();
    await server.connect(transport);
  }

  await transport.handleRequest(req, res, req.body);
});

In practice, shared session state is the difference between a prototype and a production system. Without it, a load balancer restart or a single instance crash silently kills every session pinned to that node, and your users see cryptic “session not found” errors with no recovery path.

Rate Limiting at the Gateway

Scaling the server only to leave it unprotected is a recipe for outages. Rate limiting sits at the gateway layer and prevents a single misbehaving client, or a sudden LLM retry loop, from consuming all available capacity. The following setup uses Redis so the limits are enforced consistently across all server instances.

import { RateLimiterRedis } from 'rate-limiter-flexible';

// Per-user rate limit: 60 requests per minute
const rateLimiter = new RateLimiterRedis({
  storeClient: redis,
  keyPrefix: 'mcp-rl',
  points: 60,        // Number of requests
  duration: 60,      // Per 60 seconds
  blockDuration: 60, // Block for 60 seconds after limit hit
});

// Per-IP rate limit for unauthenticated paths
const ipRateLimiter = new RateLimiterRedis({
  storeClient: redis,
  keyPrefix: 'mcp-ip-rl',
  points: 100,
  duration: 60,
});

async function rateLimit(req, res, next) {
  const key = req.auth?.sub ?? req.ip;
  try {
    await rateLimiter.consume(key);
    next();
  } catch (rl) {
    res.setHeader('Retry-After', Math.ceil(rl.msBeforeNext / 1000));
    res.setHeader('X-RateLimit-Limit', 60);
    res.setHeader('X-RateLimit-Remaining', 0);
    res.status(429).json({ error: 'too_many_requests', retryAfter: Math.ceil(rl.msBeforeNext / 1000) });
  }
}

app.use('/mcp', rateLimit);
Rate limiting Redis sliding window per user request counter 429 response with Retry-After header dark diagram
Redis-backed sliding window rate limiter: 60 req/min per user, returns 429 with Retry-After on breach.

Tool Result Caching

Many MCP tool calls hit the same data repeatedly. An LLM agent researching a product might call get_product three times in one conversation with identical arguments. Caching those results in Redis avoids redundant database queries and cuts latency for the most common patterns. The key decision is choosing TTLs that match how frequently the underlying data actually changes.

// Cache expensive or read-heavy tool call results in Redis
class ToolResultCache {
  #redis;
  #ttls;

  constructor(redis, ttls = {}) {
    this.#redis = redis;
    this.#ttls = {
      // Default TTLs per tool (seconds)
      get_product: 300,      // 5 min - product data changes rarely
      search_products: 60,   // 1 min - search results change more
      get_inventory: 10,     // 10 sec - inventory changes frequently
      get_user: 600,         // 10 min - user profile rarely changes
      ...ttls,
    };
  }

  key(toolName, args) {
    return `mcp:tool:${toolName}:${JSON.stringify(args)}`;
  }

  async get(toolName, args) {
    const cached = await this.#redis.get(this.key(toolName, args));
    return cached ? JSON.parse(cached) : null;
  }

  async set(toolName, args, result) {
    const ttl = this.#ttls[toolName];
    if (!ttl) return;  // Don't cache if no TTL defined
    await this.#redis.setEx(this.key(toolName, args), ttl, JSON.stringify(result));
  }

  async invalidate(pattern) {
    const keys = await this.#redis.keys(`mcp:tool:${pattern}:*`);
    if (keys.length) await this.#redis.del(keys);
  }
}

const toolCache = new ToolResultCache(redis);

// Wrap MCP callTool with caching
async function callToolWithCache(mcp, name, args) {
  const cached = await toolCache.get(name, args);
  if (cached) {
    return cached;
  }
  const result = await mcp.callTool({ name, arguments: args });
  await toolCache.set(name, args, result);
  return result;
}

Nginx Load Balancer Config with Sticky Sessions

With application-level concerns handled, the last piece is the load balancer itself. MCP’s SSE streaming requires long-lived connections, which means default Nginx timeouts and buffering settings will break things immediately. Watch out for proxy_buffering in particular: if left on, Nginx will hold SSE events in memory instead of forwarding them, and the client will appear to hang.

upstream mcp_servers {
    ip_hash;  # Sticky sessions by client IP
    server mcp-server-1:3000;
    server mcp-server-2:3000;
    server mcp-server-3:3000;
    keepalive 64;
}

server {
    listen 443 ssl;
    server_name mcp.yourcompany.com;

    # SSE requires long-lived connections - increase timeouts
    proxy_read_timeout 3600s;
    proxy_send_timeout 3600s;
    proxy_connect_timeout 10s;

    # Required for SSE streaming
    proxy_buffering off;
    proxy_cache off;
    proxy_set_header Connection '';
    proxy_http_version 1.1;
    chunked_transfer_encoding on;

    location /mcp {
        proxy_pass http://mcp_servers;
        proxy_set_header Host $host;
        proxy_set_header X-Real-IP $remote_addr;
        proxy_set_header X-Forwarded-For $proxy_add_x_forwarded_for;
    }

    location /health {
        proxy_pass http://mcp_servers;
        access_log off;
    }
}

A common real-world failure is caching a tool result that was specific to one user’s permissions and then serving it to another user. Always include the user or session identity in your cache key when the tool’s output depends on who is calling it. The key() method above uses only tool name and arguments, which is correct for public data but dangerous for anything access-controlled.

Scaling Decision Guide

  • Under 10 concurrent users: Single instance, no load balancer needed
  • 10-100 concurrent users: 2-3 instances with sticky sessions, Redis for rate limiting
  • 100-1000 concurrent users: 5-10 instances, Redis session store, tool result caching, dedicated rate limiting layer
  • 1000+ concurrent users: Kubernetes with horizontal pod autoscaling, Redis Cluster, API Gateway (Kong, APISIX) for rate limiting and auth

nJoy 😉

Lesson 41 of 55: Production MCP Deployment – Docker, Health Checks, Graceful Shutdown

Running an MCP server in development with node server.js and running it in production are very different things. Production requires a container image that handles signals correctly, a health check endpoint that Docker and Kubernetes can poll, graceful shutdown that finishes in-flight requests before exiting, and a process supervisor that restarts the server on crashes. This lesson builds the complete production deployment stack for an MCP server: Dockerfile, health endpoint, graceful shutdown, and Docker Compose configuration.

MCP server Docker container architecture health check graceful shutdown signal handling production deployment dark
Production MCP containers: multi-stage build, non-root user, signal handling, health endpoint.

The Production Dockerfile

# Multi-stage build: separate build and runtime stages
FROM node:22-alpine AS builder

WORKDIR /app
COPY package*.json ./
RUN npm ci --only=production

# Runtime stage: minimal image with only production deps
FROM node:22-alpine

# Run as non-root user (security best practice)
RUN addgroup -S mcp && adduser -S mcp -G mcp
WORKDIR /app

COPY --from=builder /app/node_modules ./node_modules
COPY --chown=mcp:mcp . .

USER mcp

# Health check: poll /health every 30s, timeout 5s, 3 retries before unhealthy
HEALTHCHECK --interval=30s --timeout=5s --start-period=10s --retries=3 \
  CMD wget -qO- http://localhost:3000/health || exit 1

EXPOSE 3000

# Use exec form to get PID 1 (receives SIGTERM correctly)
CMD ["node", "server.js"]

Smaller runtime images start faster, cost less to pull, and expose fewer packages to attackers. Non-root users limit damage if a dependency is compromised, and a declared HEALTHCHECK gives Docker and Kubernetes a single, consistent signal that the process is ready and still responding. Exec-form CMD matters because PID 1 must be Node so SIGTERM from docker stop or a rolling update reaches your shutdown code instead of being swallowed by a shell wrapper.

The Dockerfile assumes your app exposes /health and can exit cleanly; the next section implements that contract in Express and ties connection draining to the MCP server lifecycle.

Graceful Shutdown

import { McpServer } from '@modelcontextprotocol/sdk/server/mcp.js';
import { StreamableHTTPServerTransport } from '@modelcontextprotocol/sdk/server/streamable-http.js';
import express from 'express';

const app = express();
const server = new McpServer({ name: 'my-mcp-server', version: '1.0.0' });

// Health endpoint (required for container health checks)
app.get('/health', (req, res) => {
  res.json({ status: 'ok', uptime: process.uptime(), pid: process.pid });
});

// Track active connections for graceful drain
const activeConnections = new Set();
const httpServer = app.listen(3000, () => {
  console.log('MCP server listening on :3000');
});

httpServer.on('connection', (socket) => {
  activeConnections.add(socket);
  socket.once('close', () => activeConnections.delete(socket));
});

// Graceful shutdown handler
async function shutdown(signal) {
  console.log(`Received ${signal}, shutting down gracefully...`);

  // Stop accepting new connections
  httpServer.close(async () => {
    console.log('HTTP server closed');

    // Close MCP server (finishes in-flight tool calls)
    await server.close();
    console.log('MCP server closed');

    process.exit(0);
  });

  // Force-close remaining connections after 30 seconds
  setTimeout(() => {
    console.error('Forced shutdown after 30s timeout');
    for (const socket of activeConnections) socket.destroy();
    process.exit(1);
  }, 30_000);
}

process.on('SIGTERM', () => shutdown('SIGTERM'));
process.on('SIGINT', () => shutdown('SIGINT'));

// Prevent unhandled errors from crashing without cleanup
process.on('uncaughtException', (err) => {
  console.error('Uncaught exception:', err);
  shutdown('uncaughtException');
});

If you skip graceful shutdown, deploys and scale-down events can cut off in-flight tool calls and leave clients with ambiguous errors. In a real project, you would set container stop_grace_period and Kubernetes terminationGracePeriodSeconds slightly above your forced-shutdown timeout so the platform always waits long enough for httpServer.close and server.close() to finish.

Graceful shutdown sequence diagram SIGTERM received stop accepting connections drain requests close server exit dark
Graceful shutdown: SIGTERM -> stop accepting -> drain in-flight requests -> close MCP server -> exit 0.

Docker Compose for Production

services:
  mcp-server:
    image: mycompany/mcp-product-server:1.2.0
    restart: unless-stopped
    ports:
      - "3000:3000"
    environment:
      NODE_ENV: production
      DATABASE_URL: ${DATABASE_URL}
    env_file:
      - .env.production
    healthcheck:
      test: ["CMD", "wget", "-qO-", "http://localhost:3000/health"]
      interval: 30s
      timeout: 5s
      retries: 3
      start_period: 15s
    deploy:
      resources:
        limits:
          cpus: "1.0"
          memory: 512M
        reservations:
          cpus: "0.25"
          memory: 128M
    logging:
      driver: json-file
      options:
        max-size: "100m"
        max-file: "3"
    stop_grace_period: 30s

Compose bundles image reference, env files, log rotation, and resource caps for one host or a small staging stack without a full cluster. The same image tag and /health path you validate here should match what you promote to production so regressions show up before users do.

Kubernetes Deployment (Minimal Example)

apiVersion: apps/v1
kind: Deployment
metadata:
  name: mcp-product-server
spec:
  replicas: 2
  selector:
    matchLabels:
      app: mcp-product-server
  template:
    metadata:
      labels:
        app: mcp-product-server
    spec:
      containers:
        - name: mcp-server
          image: mycompany/mcp-product-server:1.2.0
          ports:
            - containerPort: 3000
          env:
            - name: DATABASE_URL
              valueFrom:
                secretKeyRef:
                  name: mcp-secrets
                  key: database-url
          livenessProbe:
            httpGet:
              path: /health
              port: 3000
            initialDelaySeconds: 10
            periodSeconds: 30
          readinessProbe:
            httpGet:
              path: /health
              port: 3000
            initialDelaySeconds: 5
            periodSeconds: 10
          resources:
            requests:
              memory: "128Mi"
              cpu: "250m"
            limits:
              memory: "512Mi"
              cpu: "1000m"
      terminationGracePeriodSeconds: 35

Readiness probes delay sending traffic until the pod can serve MCP traffic; liveness probes restart containers that deadlock without exiting. Running more than one replica lets you drain one instance while others keep serving. In a real project, you would mirror the DATABASE_URL pattern for all secrets and keep non-secret config in ConfigMaps so rollouts stay repeatable.

Common Deployment Failures

  • SIGTERM not reaching Node.js: If you use shell form in CMD (CMD node server.js), Docker wraps it in /bin/sh -c. The shell receives SIGTERM but does not forward it to Node. Always use exec form: CMD ["node", "server.js"].
  • Health check during startup: The server may not be ready immediately. Set start_period to give the server time to initialize before health checks begin counting failures.
  • Container running as root: Running as root means a process escape gives an attacker full container root. Always add a non-root user in the Dockerfile.
  • No resource limits: An MCP server with a memory leak will eventually OOM the host. Always set memory limits in production.

What to Build Next

  • Dockerize your existing MCP server using the multi-stage Dockerfile above. Verify that docker stop triggers graceful shutdown by checking the log output.
  • Add the /health endpoint and test it returns 200 within 5 seconds of startup.

nJoy 😉