
Chart Patterns Course – Chapter 3 of 10. Reversal patterns are where chart education usually becomes theatrical. Everyone loves a head and shoulders because it looks tidy, sounds dramatic, and gives the impression that the market has politely arranged itself into a labelled diagram for your benefit. Real reversals are messier than that. They begin with exhaustion, continue through failed continuation attempts, and only become tradable once confirmation appears.
Prior Trend Is Not Optional
A reversal pattern needs something to reverse. That sounds embarrassingly obvious, yet it is one of the most common beginner errors. Traders call every small zig-zag a double top or every slight bounce a double bottom, even when the market has not produced a meaningful prior move. Without prior trend, a reversal pattern is often just range noise. At best it is an ambiguous congestion. At worst it is a trap that invites you to short support or buy resistance in the middle of a sideways mess.
This is why good reversal analysis begins with context. The shape comes second. If the market has been in a mature uptrend, then repeated failure near a high matters. If the market has been in a downtrend, then accumulation near lows matters. Pattern geometry only earns meaning after directional context has established tension.
Head and Shoulders: Failure in Three Acts
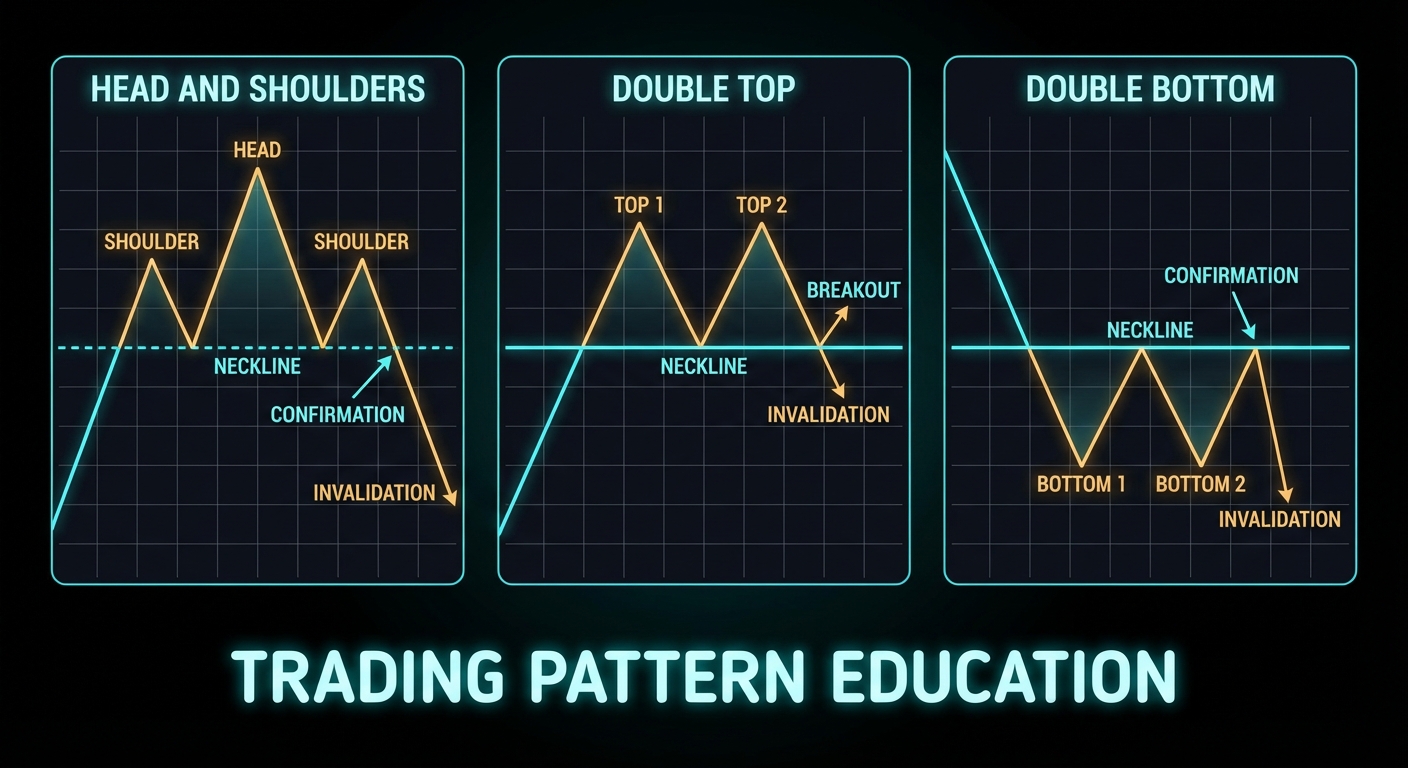
The head and shoulders pattern is best understood as a three-stage failure sequence. The left shoulder shows an initial loss of momentum after a strong advance. The head makes a higher high, but that higher high cannot sustain itself. The right shoulder then fails to make a convincing new extreme. What matters most is not the silhouette. It is the repeated inability of buyers to extend control, followed by a break of the neckline that signals the market is no longer treating the prior uptrend as intact.
This distinction matters because students often enter too early. They see the head and shoulder structure forming and start shorting before the neckline gives way. That is anticipation, not confirmation. Sometimes anticipation works. It also exposes you to the exact risk that the market simply consolidates and then resumes upward. Confirmation costs you some price, but it buys you information. In live trading, information is a very good use of money.
The inverse head and shoulders is the mirror image. Sellers progressively fail to extend the downtrend. The market builds a deeper central low, then refuses to follow through lower on the right side. When the neckline breaks upward, the prior auction logic has changed. Again, the key event is the break, not the art project.
Double Tops and Double Bottoms
Double tops and double bottoms are simpler patterns, but they are often abused because the structure looks so easy to recognise. A double top is not simply “price hit the high twice.” It is repeated failure at an extreme, followed by a break of the intervening swing low that confirms the market is willing to trade lower. A double bottom is the reverse: repeated defence near a low, then a break of the swing high between the lows. Without that confirmation level breaking, the pattern remains incomplete.
This is the central teaching point for reversal structures: the market must prove the transition. Until then, you have a possible setup, not a completed one. Many bad trades come from confusing the possibility of reversal with the fact of reversal.
What The Evidence Says
Pattern-specific evidence is thinner than the textbooks imply, but it is not empty. One of the strongest direct studies on a named pattern comes from Savin, Weller, and Zvingelis on head and shoulders in U.S. equities. Their results are exactly the kind of nuance this course wants to preserve: not a blanket endorsement, not a blanket dismissal.
The study did not support a naive “trade every head and shoulders and get rich” interpretation. What it did support was conditional predictive value and improved risk-adjusted results when the structure was used more carefully. That is a recurring theme across respectable chart-pattern research. The shape may carry information, but the value is conditional, implementation-sensitive, and rarely as clean as the retail versions claim.
Lo, Mamaysky, and Wang provide the broader academic umbrella for this idea by showing that technical structures such as head and shoulders and double bottoms can provide incremental information. Again, modest claim, useful claim. Not magical claim.
Where Reversal Patterns Fail
Reversal patterns fail in predictable ways. First, traders enter before confirmation. Second, the prior trend was too weak or too short to matter. Third, the setup forms directly into strong higher-timeframe support or resistance, which means the supposed reversal is actually running into a larger opposing force. Fourth, traders ignore participation and follow-through. A neckline break on weak involvement can still work, but it deserves more caution than a break with strong market acceptance.
# Weak reversal logic
if pattern == "head_and_shoulders":
    short()

# Better reversal logic
if prior_trend_up and neckline_break and follow_through_present:
    short()
There is also a deeper lesson here: failed reversal patterns can become powerful continuation signals. If a beautiful head and shoulders cannot break down and instead reclaims the neckline aggressively, that failure tells you something important. The market has absorbed the bearish story and refused to comply. In trading, failed signals are often as informative as successful ones.
Measured Moves and Invalidation
Classic texts often teach measured-move targets by projecting the height of the pattern from the breakout point. That can be useful as a planning device. It is not a law of nature. The measured move is a heuristic for thinking about potential reward, not an exact destination. Invalidation is more important than target mythology. If the market reclaims the neckline after a downside break or collapses back below it after an inverse breakout, your thesis is degrading and your risk should already be defined.
How To Trade Them Like An Adult
A serious reversal trader asks four questions. Was there a real prior trend? Is the pattern complete or merely forming? Is the confirmation level clear? Is the invalidation level clear? If the answer to any of those is vague, you probably do not have a trade. That discipline feels less exciting than calling tops on social media. It is also much more compatible with long-term survival.
Summary Takeaway
Reversal patterns are best understood as failed continuation structures that become tradable only after confirmation. Prior trend, break of the confirmation level, and clear invalidation matter far more than how aesthetically pleasing the pattern looks on a screenshot.
Course Navigation
Previous: Market Structure for Chart Patterns: Trend, Support, Resistance, and Volume
Next: Continuation Chart Patterns: Flags, Pennants, Triangles, and Rectangles
Full course: Chart Patterns Course – Evidence, Execution, and Risk
This chapter is part of the Chart Patterns Course.