
Chart Patterns Course. This 10-chapter series is designed for people who want something stricter than retail pattern folklore and more practical than pure academic dismissal. The goal is simple: understand what chart patterns describe, when they are useful, when they fail, and how to turn them into disciplined trading decisions without pretending that triangles have supernatural powers.
What This Course Covers
Most chart-pattern courses jump from shape recognition straight to trade entry, as if the market exists solely to reward anyone who spots a head and shoulders before breakfast. This course takes the opposite route. We begin with definitions and market structure, move through reversal and continuation setups, then spend serious time on breakouts, timeframes, regime filters, sizing, expectancy, evidence, backtesting, and professional deployment. In other words, the shapes are only the beginning.
The material is grounded in a mix of practitioner and academic sources. You will see classic references where terminology matters, but the course leans on evidence from Andrew Lo, Harry Mamaysky, Jiang Wang, Carol Osler, modern support-and-resistance studies, trend-following research from AQR, and institutional material from CME, FINRA, the SEC, and ESMA. That balance matters. Pattern trading becomes dangerous when students are given the vocabulary of technical analysis without the discipline of risk management and the humility of evidence.
How To Use The Series
Read the course in order if you are new to the topic. If you already trade patterns, Chapters 7 through 10 will probably hurt your feelings in a productive way because they focus on the part that actually decides whether a strategy survives: stop placement, position sizing, cost drag, test design, execution logic, and review discipline. The market does not care how beautiful your ascending triangle looked on TradingView if the setup was taken in the wrong regime with a stop parked exactly where everyone else parked theirs.
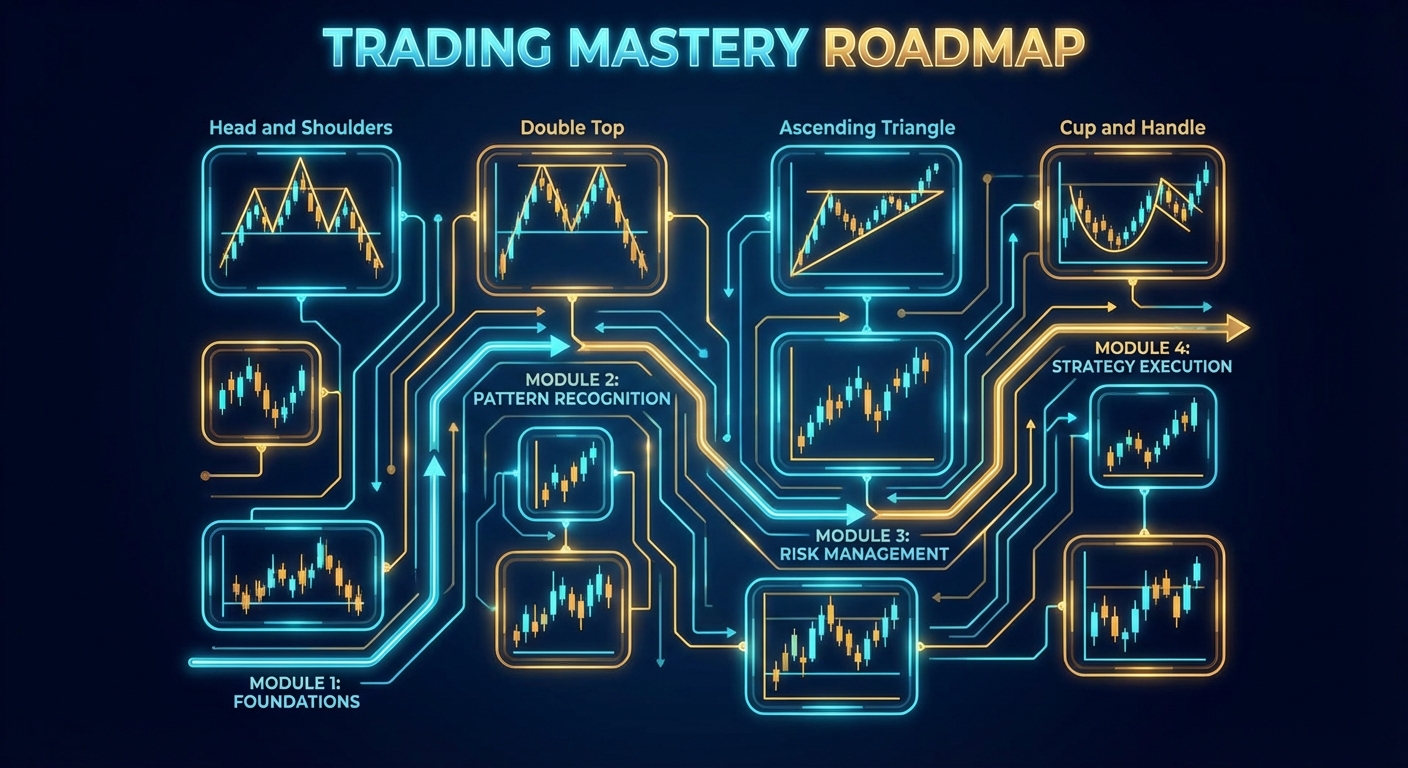
Each chapter includes one core illustration, one focused lesson, and a short summary takeaway at the bottom. Every chapter also links to the previous chapter, the next chapter, and this full course page so the structure behaves like a proper course rather than a pile of disconnected blog posts.
Course Table of Contents
Part 1: Foundations and Pattern Logic
- Chart Patterns Foundations: What They Are and What They Are Not – a disciplined definition of patterns, subjectivity, and the difference between information and folklore
- Market Structure for Chart Patterns: Trend, Support, Resistance, and Volume – the context layer that gives a pattern meaning
- Reversal Chart Patterns: Head and Shoulders, Double Tops, and Double Bottoms – prior trend, confirmation, invalidation, and common reversal traps
Part 2: Continuation, Breaks, and Context
- Continuation Chart Patterns: Flags, Pennants, Triangles, and Rectangles – compression, continuation, and measured-move logic
- Breakouts and False Breakouts: Entries, Retests, and Failure Traps – what acceptance really looks like at a level
- Timeframes and Regime Filters: When Chart Patterns Matter Most – why the same setup behaves differently across horizons and market states
Part 3: Risk, Evidence, and Professional Execution
- Risk, Targets, Position Sizing, and Expectancy for Chart Pattern Trades – invalidation, size, net edge, and survival
- Chart Pattern Evidence and Success Rates: What the Research Actually Says – the chapter that rescues you from made-up win-rate tables
- Turning Chart Patterns into Rules: Scanners, Backtests, and Execution Logic – from eyeballing to testable logic
- A Professional Chart Patterns Playbook: Checklist, Review, and Deployment – the operating manual for using patterns without turning your account into a cautionary tale
Who This Is For
This course is for discretionary traders who want better structure, system builders who want cleaner definitions, and beginners who would rather learn the hard parts before the market teaches them using actual money. It is not for people who want a magic success rate, a single indicator to bless every trade, or a story about how “smart money” secretly paints every chart pattern by hand like a villain in a low-budget thriller.
If you want a quick entry point before diving into the full series, start with the existing introduction article: Mastering Chart Patterns: A New Course on What Actually Works. That article sets the tone. This page is the full map.
Start Here
Begin with: Chart Patterns Foundations: What They Are and What They Are Not
This course is part of the finance content on SudoAll and is built from the source video, independent research, and additional primary material from academic and institutional references.