
You cannot fix what you cannot measure. MCP applications introduce new failure surfaces: tool latency, LLM token costs per request, session counts, tool call error rates, and the latency contribution of each component in a multi-step agent run. This lesson builds the observability stack for an MCP server: structured logging with correlation IDs, Prometheus metrics, and OpenTelemetry distributed tracing that shows the full span from user request to final LLM response.

Structured Logging with Correlation IDs
// Every log line includes a correlation ID that spans the full request lifecycle
import crypto from 'node:crypto';

class Logger {
  #context;

  constructor(context = {}) {
    this.#context = context;
  }

  child(context) {
    return new Logger({ ...this.#context, ...context });
  }

  #log(level, message, extra = {}) {
    process.stdout.write(JSON.stringify({
      timestamp: new Date().toISOString(),
      level,
      message,
      ...this.#context,
      ...extra,
    }) + '\n');
  }

  info(msg, extra) { this.#log('info', msg, extra); }
  warn(msg, extra) { this.#log('warn', msg, extra); }
  error(msg, extra) { this.#log('error', msg, extra); }
}

const rootLogger = new Logger({ service: 'mcp-server', version: '1.0.0' });

// Per-request logger with correlation ID
app.use((req, res, next) => {
  const requestId = req.headers['x-request-id'] ?? crypto.randomUUID();
  req.log = rootLogger.child({ requestId, path: req.path, method: req.method });
  res.setHeader('x-request-id', requestId);
  req.log.info('Request received');
  next();
});
Plain console logs are hard to grep at volume and impossible to stitch across services. JSON lines with a stable requestId let you jump from one error line to the full story in log aggregators and prove which user or agent session triggered a spike in tool errors.
Prometheus Metrics
npm install prom-client
import { Registry, Counter, Histogram, Gauge } from 'prom-client';

const registry = new Registry();

// Tool call metrics
const toolCallTotal = new Counter({
  name: 'mcp_tool_calls_total',
  help: 'Total number of MCP tool calls',
  labelNames: ['tool_name', 'status'],
  registers: [registry],
});

const toolCallDuration = new Histogram({
  name: 'mcp_tool_call_duration_seconds',
  help: 'Duration of MCP tool calls in seconds',
  labelNames: ['tool_name'],
  buckets: [0.01, 0.05, 0.1, 0.5, 1, 5, 10, 30],
  registers: [registry],
});

const activeSessions = new Gauge({
  name: 'mcp_active_sessions',
  help: 'Number of active MCP sessions',
  registers: [registry],
});

const llmTokensTotal = new Counter({
  name: 'mcp_llm_tokens_total',
  help: 'Total LLM tokens consumed',
  labelNames: ['provider', 'model', 'type'],
  registers: [registry],
});

// Expose /metrics endpoint for Prometheus scraping
app.get('/metrics', async (req, res) => {
  res.setHeader('Content-Type', registry.contentType);
  res.end(await registry.metrics());
});

// Instrument tool calls
function instrumentedToolCall(name, handler) {
  return async (args, context) => {
    const end = toolCallDuration.startTimer({ tool_name: name });
    try {
      const result = await handler(args, context);
      const status = result?.isError ? 'error' : 'success';
      toolCallTotal.inc({ tool_name: name, status });
      return result;
    } catch (err) {
      toolCallTotal.inc({ tool_name: name, status: 'exception' });
      throw err;
    } finally {
      end();
    }
  };
}
Counters and histograms turn noisy tool traffic into SLO-friendly views: which tools fail, how slow p95 is, and whether sessions or token burn are climbing. In a real project, you would wrap each registered tool with instrumentedToolCall (or equivalent) so every path records latency and outcome without hand-maintained log parsing.
OpenTelemetry Distributed Tracing
npm install @opentelemetry/sdk-node @opentelemetry/auto-instrumentations-node \
            @opentelemetry/exporter-trace-otlp-http
// tracing.js - Load this BEFORE any other imports
import { NodeSDK } from '@opentelemetry/sdk-node';
import { OTLPTraceExporter } from '@opentelemetry/exporter-trace-otlp-http';
import { getNodeAutoInstrumentations } from '@opentelemetry/auto-instrumentations-node';

const sdk = new NodeSDK({
  traceExporter: new OTLPTraceExporter({
    url: process.env.OTEL_EXPORTER_OTLP_ENDPOINT ?? 'http://localhost:4318/v1/traces',
  }),
  instrumentations: [getNodeAutoInstrumentations()],
  serviceName: 'mcp-server',
  serviceVersion: process.env.npm_package_version,
});

sdk.start();
process.on('SIGTERM', () => sdk.shutdown());
Auto-instrumentation captures HTTP and many libraries with little code, but the SDK must start before other modules load or spans will be incomplete. Point OTEL_EXPORTER_OTLP_ENDPOINT at your collector (Grafana Agent, Datadog Agent, vendor OTLP ingress) so traces leave the pod with the same labels you use for metrics.
// Add custom spans for MCP tool calls
import { trace, SpanStatusCode } from '@opentelemetry/api';

const tracer = trace.getTracer('mcp-server');

function tracedToolCall(name, handler) {
  return async (args, context) => {
    return tracer.startActiveSpan(`mcp.tool.${name}`, async (span) => {
      span.setAttributes({
        'mcp.tool.name': name,
        'mcp.session.id': context.sessionId ?? 'unknown',
        'mcp.arg.keys': JSON.stringify(Object.keys(args)),
      });

      try {
        const result = await handler(args, context);
        span.setStatus({ code: result?.isError ? SpanStatusCode.ERROR : SpanStatusCode.OK });
        return result;
      } catch (err) {
        span.recordException(err);
        span.setStatus({ code: SpanStatusCode.ERROR, message: err.message });
        throw err;
      } finally {
        span.end();
      }
    });
  };
}
Custom spans make the MCP layer visible inside a trace: you see tool name, session, and failure mode next to downstream HTTP or DB spans. That closes the loop when metrics show latency but logs do not say which hop grew; the following queries turn the same series into boards and on-call dashboards.
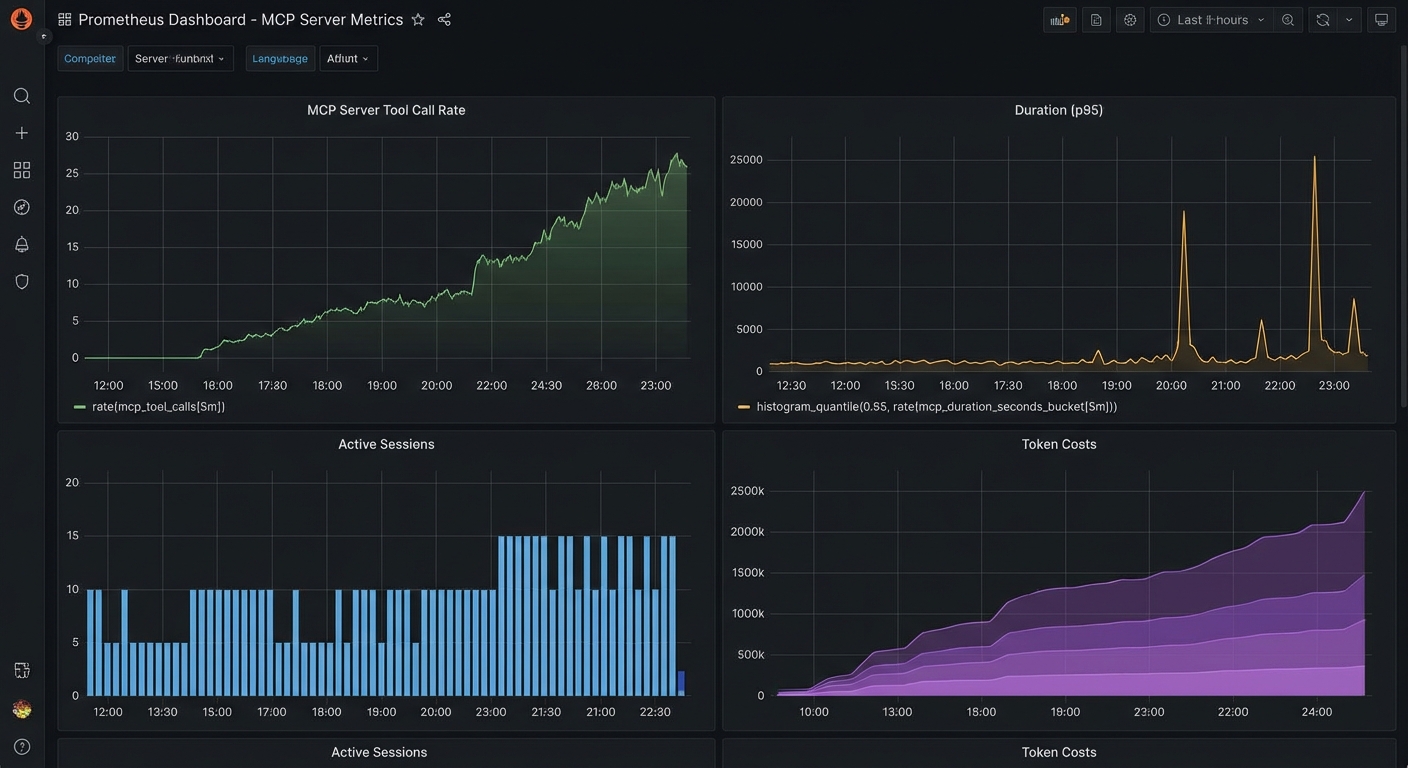
Grafana Dashboard Queries
# Top 5 slowest tools (p95 latency)
histogram_quantile(0.95, sum(rate(mcp_tool_call_duration_seconds_bucket[5m])) by (le, tool_name))

# Tool error rate
sum(rate(mcp_tool_calls_total{status="error"}[5m])) by (tool_name)
/
sum(rate(mcp_tool_calls_total[5m])) by (tool_name)

# Token cost per hour (estimated)
sum(increase(mcp_llm_tokens_total{type="input"}[1h])) by (model) * 0.0000025

# Active sessions over time
mcp_active_sessions
OpenTelemetry Trace Context in MCP
New in Draft – This convention is documented in the Draft spec and may be finalised in a future revision.
The Draft specification documents a standard convention for propagating OpenTelemetry trace context through MCP messages. Any request or notification can include traceparent, tracestate, and baggage keys in the _meta field, following the W3C Trace Context format. This lets traces flow seamlessly from an MCP client through the server and into downstream services (databases, APIs, queues) without custom propagation code.
// Client: include OTel trace context in an MCP request
const response = await client.request({
  method: 'tools/call',
  params: {
    name: 'query_database',
    arguments: { sql: 'SELECT * FROM orders LIMIT 10' },
    _meta: {
      traceparent: '00-4bf92f3577b34da6a3ce929d0e0e4736-00f067aa0ba902b7-01',
      tracestate: 'vendor=mycompany',
      baggage: 'userId=alice,tenant=acme',
    },
  },
});

// Server: extract trace context from _meta and create a child span
function handleToolCall(params) {
  const { traceparent, tracestate, baggage } = params._meta ?? {};

  // Use the W3C propagator to create a context from the incoming headers
  const parentContext = propagation.extract(ROOT_CONTEXT, {
    traceparent,
    tracestate,
    baggage,
  });

  return tracer.startActiveSpan('mcp.tools/call', { attributes: {
    'mcp.tool.name': params.name,
  }}, parentContext, async (span) => {
    try {
      const result = await executeToolHandler(params);
      span.setStatus({ code: SpanStatusCode.OK });
      return result;
    } finally {
      span.end();
    }
  });
}
With this convention, a single trace can show the full journey: user action in the host, MCP client request, server tool execution, database query, and back. This is essential for debugging latency in production MCP deployments where the bottleneck could be anywhere in the chain.
Key Alerts to Configure
- Tool error rate > 5% for 5 minutes: A specific tool may be failing due to a backend outage or schema change
- p95 tool latency > 10 seconds for 5 minutes: A tool is consistently slow – investigate the backend
- Active sessions > 1000: Approaching capacity – scale up or investigate for session leaks
- LLM token rate > 2x baseline: Possible runaway agent loop – investigate with trace data
nJoy 😉