
Full course here: Chart Patterns Course – Evidence, Execution, and Risk. If you want the full 10-chapter version with table of contents, previous/next chapter navigation, and dedicated lessons on risk, backtesting, and evidence, start there after this introduction.
Chart patterns are the finance equivalent of seeing constellations. Sometimes the stars really do line up, but only if you stop pretending every triangle is destiny. Fortune Talks’ long YouTube course gets one important thing right: patterns are visual summaries of supply, demand, hesitation, and breakout pressure. Where most beginner courses go wrong is turning that into a treasure map. A head and shoulders is not money. It is a conditional setup that needs trend context, participation, and disciplined execution.

What Chart Patterns Really Capture
At their best, chart patterns compress crowd behaviour into shapes traders can act on. Flags and triangles describe pauses inside a trend. Double tops, double bottoms, and head-and-shoulders structures describe failed auctions where one side is losing control. Andrew Lo, Harry Mamaysky, and Jiang Wang tried to move this subject from folklore to measurement by formalising pattern recognition on decades of U.S. stock data.
“over the 31-year sample period, several technical indicators do provide incremental information and may have some practical value.” – Lo, Mamaysky, and Wang, Foundations of Technical Analysis
That is the key correction to the “all patterns work” myth. The serious claim is not that geometry predicts price by magic. The serious claim is that recurring structures can shift the distribution of outcomes. Kahneman’s warning in Thinking, Fast and Slow fits perfectly here: the human brain loves fast pattern recognition, but markets punish fast certainty. A chart pattern is a hypothesis, not a verdict.
What Is the Success Rate, Actually?
The honest answer is that there is no single success rate worth tattooing on your keyboard. Results vary by market, timeframe, execution quality, fees, and whether you trade the breakout, the close, or the retest. The respectable literature says three useful things. First, patterns can contain information. Second, that information is conditional rather than universal. Third, implementation quality decides whether the edge survives transaction costs.
“These tests strongly support the claim that support and resistance levels help predict intraday trend interruptions for exchange rates.” – Carol Osler, Federal Reserve Bank of New York
Osler’s work matters because it tests signals used by real market participants rather than fantasy charts drawn after the move. More recent quantitative work reached a similar conclusion on intraday support and resistance:
“Our simple approach discovers SR levels which are able to reverse price trends statistically significantly.” – Chung and Bellotti, Evidence and Behaviour of Support and Resistance Levels in Financial Time Series
The pattern-specific evidence is mixed but not empty. In research on U.S. equities, Savin, Weller, and Zvingelis reported that head-and-shoulders signals improved risk-adjusted returns when used conditionally, but they did not support a naive stand-alone trading religion. That is the real lesson. Patterns can add information. They rarely deserve to be your entire trading system.
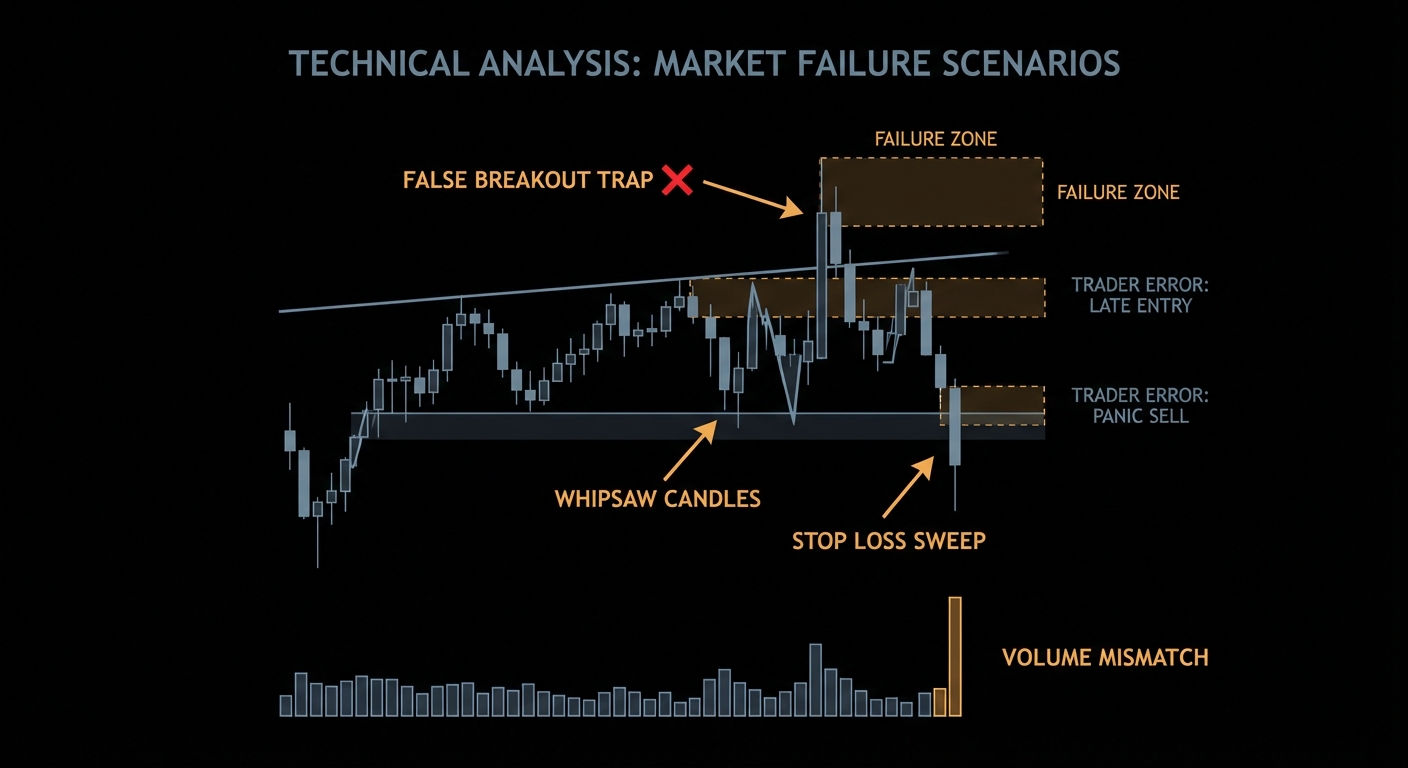
The Failure Cases Beginners Learn the Hard Way
Case 1: Entering before the breakout is confirmed
The video correctly emphasises breakout logic. The trap is anticipation. Traders see an ascending triangle, jump early, and call it conviction. The market calls it liquidity.
# Bad: trade the pattern before confirmation
if pattern == "ascending_triangle":
    buy()

# Better: require a decisive close and participation
if pattern == "ascending_triangle" and close > resistance and volume > 1.5 * avg_volume_20:
    buy()
Premature entries convert a probabilistic setup into a coin flip with worse pricing.
Case 2: Ignoring the higher timeframe regime
A bullish flag inside a clean weekly uptrend is not the same object as a bullish flag under a falling 200-day moving average. One is continuation. The other is often a dead-cat drawing with better marketing.
# Bad: every flag gets treated equally
signal = detect_flag(data)

# Better: trade with regime
signal = detect_flag(data)
trend_ok = close > ema_50 and ema_50 > ema_200
if signal and trend_ok:
    buy()
Case 3: Pretending measured-move targets beat transaction costs by default
This is where most course material becomes decorative. A 1.2R setup on a noisy intraday chart can look beautiful and still be useless after spread, slippage, and misses.
# Bad: fixed tiny edge, no cost check
gross_r = (target - entry) / (entry - stop)
take_trade = gross_r > 0

# Better: trade only if net expectancy survives costs
cost_in_r = spread_cost + slippage_cost + missed_fill_cost
gross_r = (target - entry) / (entry - stop)
net_edge = gross_r - cost_in_r
if gross_r >= 1.8 and net_edge > 0:
    take_trade = True
This is the part beginners skip because it is less exciting than spotting a cup and handle. It is also the part that decides whether you stay in the game.
Best Ways to Implement Chart Patterns in Practice
If you actually want to use the ideas from the course, do it like a process engineer, not a pattern tourist. Restrict yourself to liquid instruments. Start with regime classification. Define the trigger mechanically. Require confirmation. Then place the stop where the thesis is invalidated, not where your ego gets uncomfortable. The video is right that timeframes matter: daily and four-hour structures are usually more reliable than frantic one-minute pattern hunting because more participants see them and cost drag is smaller.
Step 1: Restrict the universe. Focus on liquid names or liquid index products.
Step 2: Start with regime. Continuation patterns need trend persistence; reversal patterns need exhaustion plus failed follow-through.
Step 3: Define the trigger mechanically. Use a closing break beyond the boundary, a retest rule, or both.
Step 4: Require confirmation. Volume expansion and volatility contraction before breakout help filter noise.
Step 5: Size the trade from the stop. Risk per trade should be fixed before the order is sent.
def trade_pattern(pattern, data):
    if not pattern.confirmed_close:
        return None
    if not data.regime_is_aligned:
        return None
    if data.breakout_volume < 1.5 * data.avg_volume_20:
        return None
    entry = data.close
    stop = pattern.invalidation_level
    target = entry + 2 * (entry - stop)
    return {"entry": entry, "stop": stop, "target": target}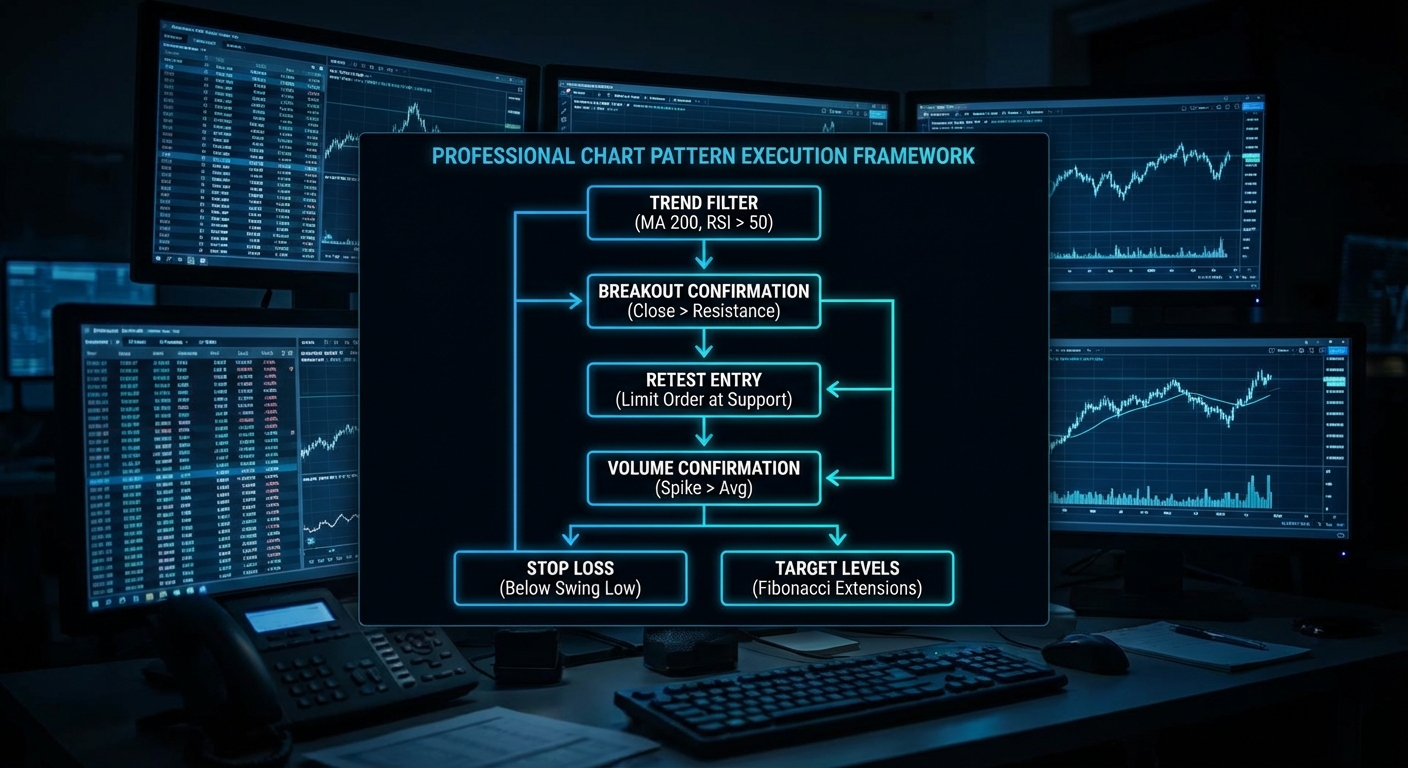
When Chart Patterns Are Actually Fine
Chart patterns are perfectly respectable when used as a language for trade location, watchlist construction, and risk definition. They are especially useful for swing traders who need a structured way to organise entries and invalidation points. They are much less convincing as a stand-alone alpha source in fast, fee-heavy intraday trading. Put differently: patterns work better as a decision framework than as a superstition.
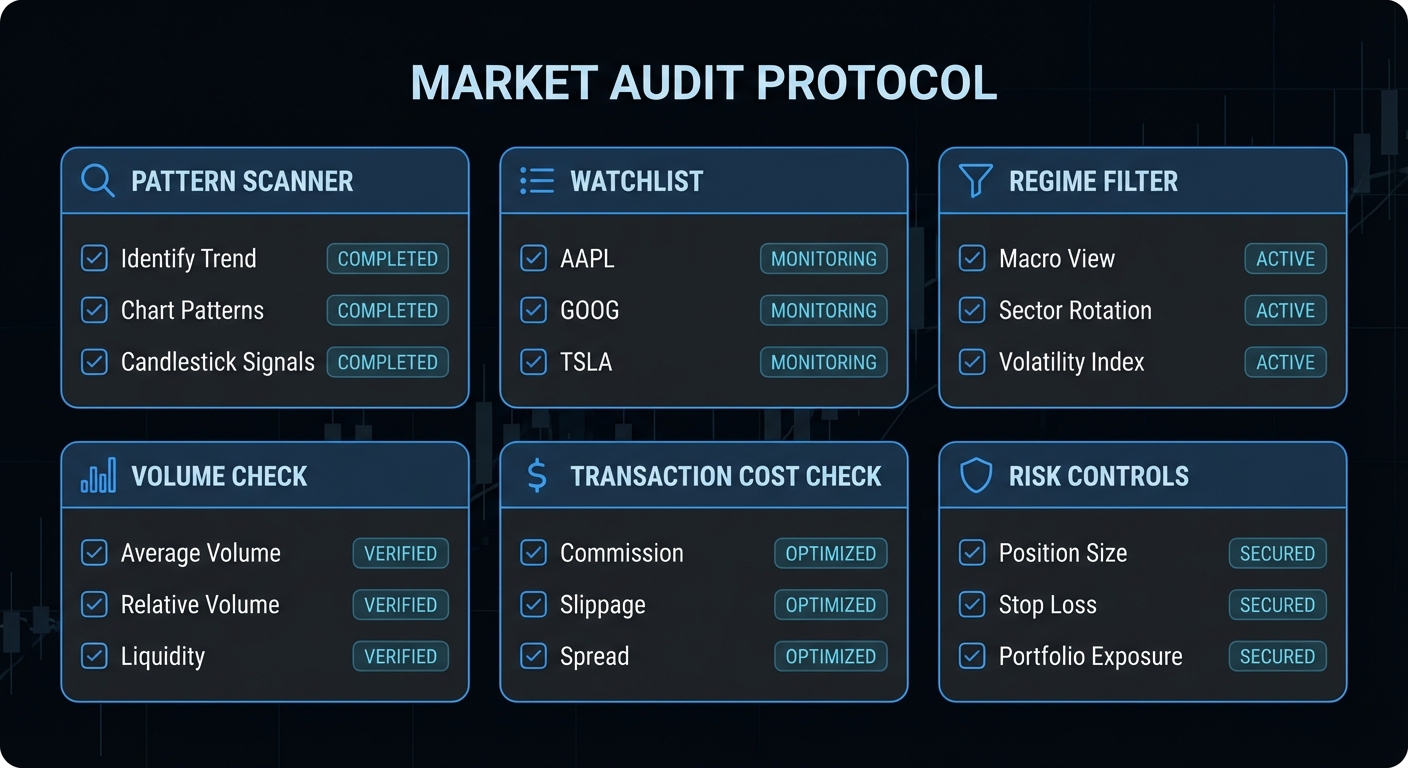
What to Check Right Now
- Backtest one pattern at a time with real spreads and slippage before adding it to your playbook.
- Separate continuation from reversal setups because their failure mechanics are different.
- Track expectancy, not just win rate. A lower win rate can still be superior if average winners are materially larger than average losers.
- Use daily or four-hour charts first if you are learning. Higher timeframes usually mean cleaner structure and lower cost drag.
- Review every false breakout to see whether volume, regime, or liquidity should have filtered it out.
Video Attribution
This article builds on the educational YouTube course below and adds the quantitative evidence, implementation rules, and failure analysis that most chart-pattern tutorials leave out.
Watch the original Fortune Talks video on YouTube.
nJoy 😉