
Chart Patterns Course – Chapter 6 of 10. A pattern does not live on a chart. It lives on a timeframe inside a market regime. That sentence explains a shocking number of trading disasters. The same bull flag can be a sensible continuation setup on a daily chart inside a weekly uptrend and a complete waste of attention on a one-minute chart inside a thin, whippy session. Timeframe and regime decide whether the pattern deserves your energy at all.
Why Higher Timeframes Usually Behave Better
Beginners are often attracted to lower timeframes because they seem exciting, active, and full of opportunity. They are also full of noise, cost drag, and microstructure distortion. Research on high-frequency market microstructure makes this point clearly: the lower the horizon, the more price is distorted by bid-ask bounce, short-term order imbalances, and other effects that have very little to do with the clean textbook pattern you think you are trading.
That is why higher timeframes often produce more teachable pattern behaviour. Not because the market suddenly becomes honest, but because the structural signal is larger relative to the noise and costs. A daily triangle or four-hour rectangle usually gives you a cleaner relationship between structure, invalidation, and reward than a frenetic one-minute pattern that lives inside spread and slippage.
Regime Filters Are Not Cosmetic
Continuation patterns depend on continuation. That sounds trivial, but it means they are deeply regime-dependent. Trend-following research from AQR and related work across asset classes supports a broad fact: own-price trends can persist across intermediate horizons. That does not prove every triangle works. It does tell you that a market in persistent trend is fundamentally a better home for continuation logic than a market whipsawing inside a mean-reverting chop zone.
Regime filters are the bridge from that evidence to practical trading. You can define regime using moving-average alignment, price relative to a long-term average, volatility state, momentum state, or a simple higher-high/higher-low structure. The exact filter matters less than the discipline of having one. The point is to ask “what kind of market am I in?” before asking “what does this pattern mean?”
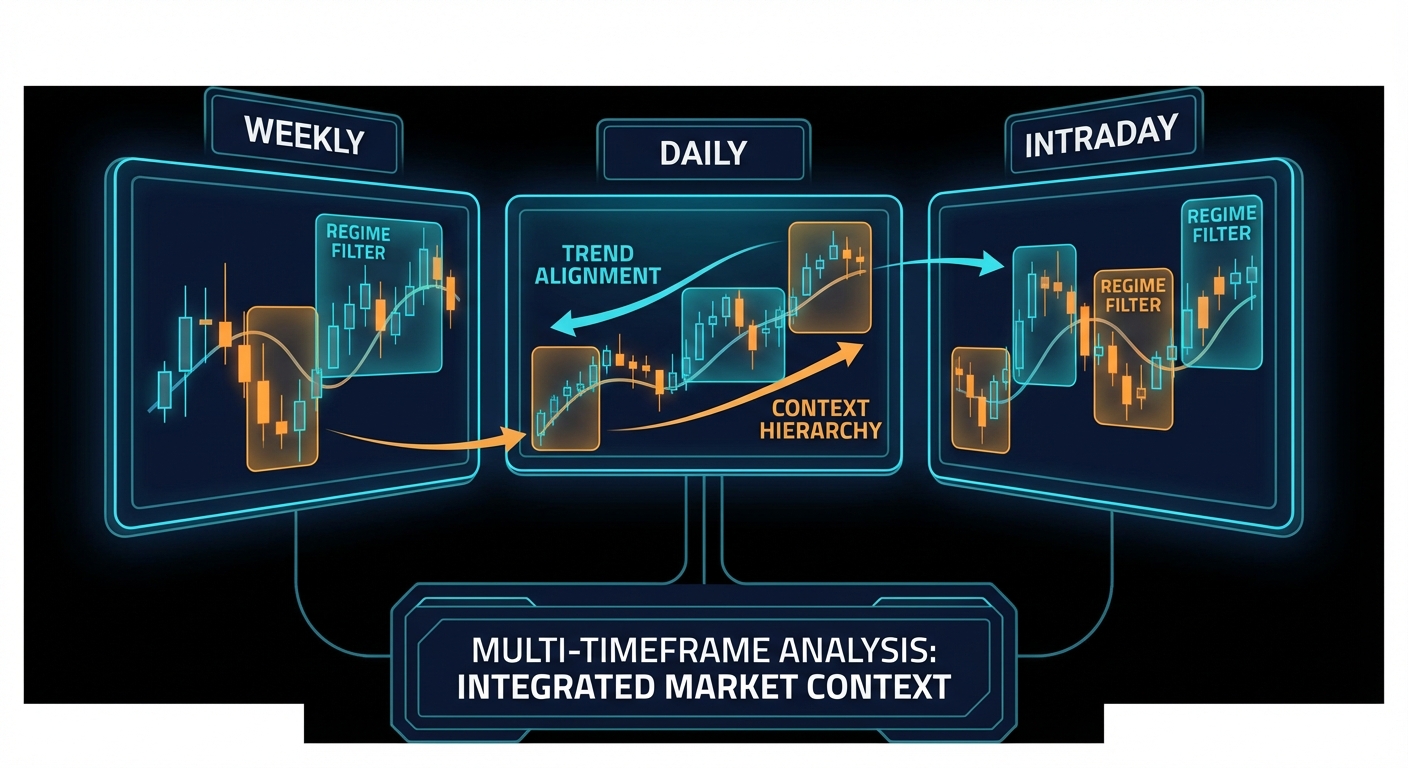
Multi-Timeframe Thinking
A robust pattern process often uses two horizons. The higher timeframe establishes directional bias and major levels. The lower timeframe handles execution. For example, you might identify a weekly uptrend and daily consolidation, then use a four-hour breakout for entry. This avoids one of the classic retail errors: making every decision from a single chart and acting surprised when a beautiful local setup runs directly into a much larger zone visible one screen up.
Multi-timeframe thinking does not require excessive complexity. It only requires hierarchy. One timeframe tells you the environment. Another tells you the trigger. If those two disagree violently, smaller size or no trade is often the correct response.
Signal Strength Matters
Another useful lesson from the trend-following literature is that signal quality varies. Some trends are mature, broad, and persistent. Others are fragile, late, or already near exhaustion. Research on trend signal strength and CTA performance is helpful here because it reinforces a key trading intuition: directional bias alone is not enough. Strong trends and weak trends should not be treated as the same object.
Translated into pattern trading, this means a continuation pattern in a strong, orderly trend deserves more respect than the same shape inside a hesitant, news-whipped environment. Likewise, a reversal pattern against a powerful established trend deserves extra caution unless other evidence of exhaustion is present.
# Simple regime-aware filter
trend_up = close > ema_50 and ema_50 > ema_200
volatility_ok = atr_percentile < max_threshold

if trend_up and volatility_ok and breakout_confirmed:
    take_trade()
When Timeframes Work Against You
Higher timeframes are not automatically superior in every way. They reduce noise, but they also reduce sample size and can react slowly to turning points. Lower timeframes provide more opportunities, but those opportunities are more vulnerable to friction and false signals. This is why no timeframe should be marketed as “the best.” The question is best for what. Swing traders looking for structured continuation may prefer daily and four-hour charts. Intraday traders may need lower horizons, but they should accept that pattern quality degrades and execution quality becomes much more important.
Context Changes The Same Pattern
A rectangle after a parabolic run may be distribution. The same rectangle early in a stable trend may be healthy balance. A double bottom in a long-term downtrend may be just another bounce until the higher timeframe agrees. A breakout from a triangle during a macro event week may be less about the triangle and more about the event. Regime awareness forces you to stop treating the pattern as the main character in a market that is often being driven by larger forces.
This chapter also rescues you from one of the most common retail delusions: the belief that more charts mean more clarity. Often the opposite is true. The extra clarity comes from choosing the right horizon and letting the wrong ones go.
A Default Workflow That Actually Works
A sensible course default is simple. Use the weekly or daily chart for directional bias and major levels. Use the four-hour or daily chart for setup structure. Use a still lower timeframe only if you need execution refinement and you already know the broader context. That hierarchy is not glamorous, but it keeps you from getting hypnotised by noise. It also reinforces a deep truth: regime is not an optional add-on to pattern trading. It is the environment that decides whether the pattern deserves to exist in your process at all.
Summary Takeaway
Timeframe and regime determine whether a chart pattern is meaningful, noisy, or actively misleading. Higher-level context, trend state, and signal strength should be established before you start naming shapes and planning entries.
Course Navigation
Previous: Breakouts and False Breakouts: Entries, Retests, and Failure Traps
Next: Risk, Targets, Position Sizing, and Expectancy for Chart Pattern Trades
Full course: Chart Patterns Course – Evidence, Execution, and Risk
This chapter is part of the Chart Patterns Course.