
Chart Patterns Course – Chapter 7 of 10. This chapter is where many pattern traders realise they were never really trading patterns at all. They were trading hope with decorative geometry. Real trading begins with invalidation, position sizing, and expectancy. Entry comes after that. If you reverse the order, the market will eventually explain the difference using your account balance.
Start With Invalidation, Not Entry
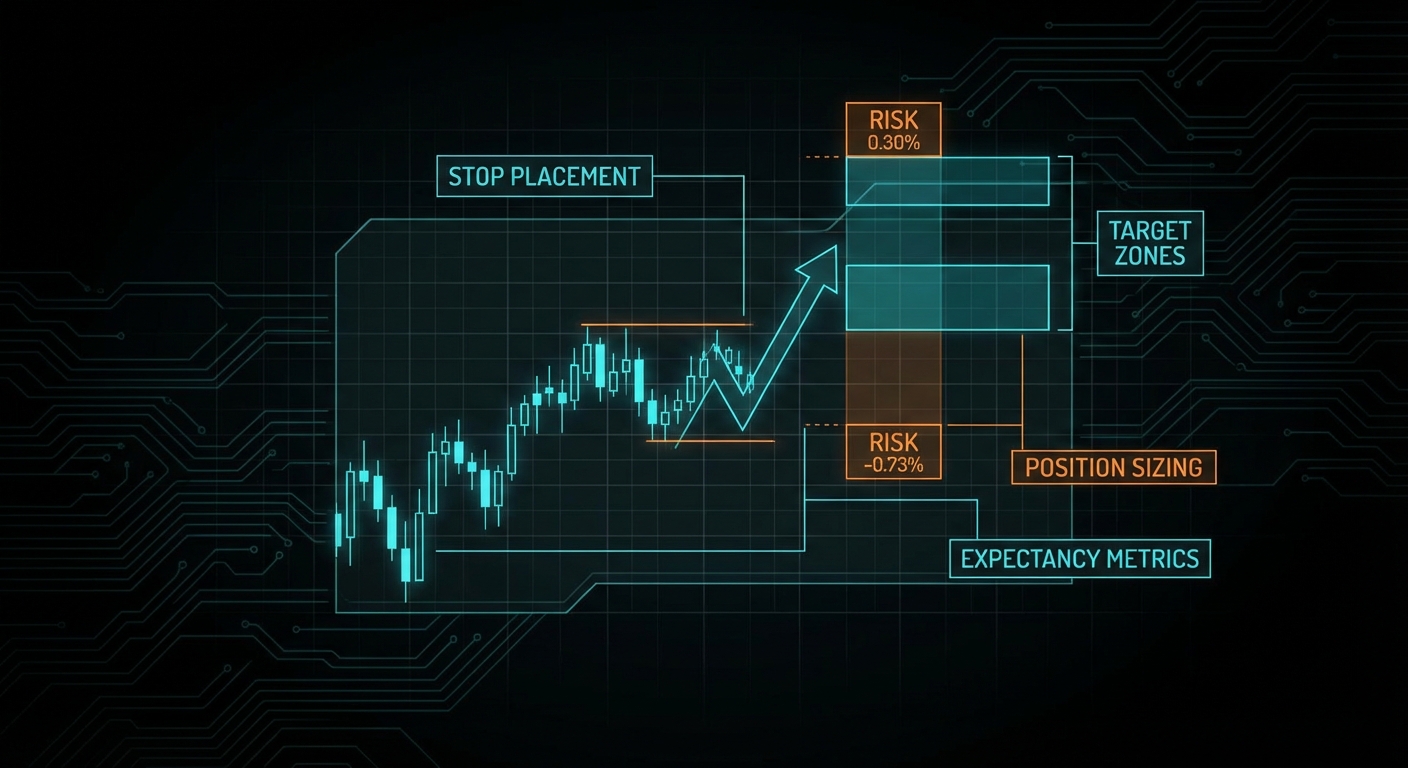
The first practical question in any chart-pattern trade is not “where do I get in?” It is “what would prove me wrong?” That is the invalidation level. If you are trading a breakout, invalidation may sit back inside the structure or below the most relevant defended low. If you are trading a reversal, invalidation may sit beyond the shoulder, the retest, or the reclaimed neckline. The point is that the stop belongs where the thesis is broken, not where a convenient percentage makes your spreadsheet feel calmer.
This sounds obvious, yet a surprising amount of trading advice effectively chooses the stop to make the trade size look attractive. That is backwards. The market defines the logical stop. Your account decides whether the size is acceptable. If the size becomes too small to interest you, that is not a reason to move the stop closer. It is a reason not to take the trade.
Position Size Is Derived, Not Improvised
CME’s educational material on position sizing is refreshingly practical. It begins with account risk, then maps that risk to stop distance and contract or share size. This is the proper order. Wider stop means smaller size. Narrower stop means larger size, but only if the stop still makes sense structurally. The stop is not a decorative accessory. It is the bridge between market logic and account survival.
account_risk_dollars = account_equity * 0.01
trade_risk_per_unit = abs(entry - stop)
position_size = account_risk_dollars / trade_risk_per_unit
The little equation above is not glamorous, which is why people skip it. It is also one of the few places in trading where arithmetic actively protects you from your own enthusiasm.
Targets Are Planning Tools
Targets matter, but not in the heroic way many chart-pattern books suggest. A measured move, prior swing, volatility expansion target, or fixed reward-to-risk multiple is useful because it lets you evaluate whether the opportunity survives costs and variance. It is not useful because it grants prophecy. Price does not know your 2R objective. It may stall early, overshoot wildly, or never get there at all.
The right way to use targets is to estimate expected payoff relative to risk. If a breakout setup offers only a tiny gross edge once spread, slippage, and missed fill risk are included, then even a textbook pattern may be untradeable. This is why the quality of the pattern and the quality of the trade are related but not identical things.
Expectancy Beats Win Rate
Retail traders love win rate because it is emotionally legible. A high win rate feels intelligent. Expectancy is the more useful measure. Expectancy asks how much you make on average, after accounting for winners, losers, size, and cost. A strategy with a 40 percent win rate can be excellent if winners are much larger than losers. A strategy with a 70 percent win rate can be dreadful if the occasional loser is catastrophic or costs eat the entire edge.
This is especially important for chart patterns because many visually appealing setups offer modest reward relative to structural risk. They look clean on the chart, but the net edge after execution friction is thin. That is how traders become rich in screenshots and poor in statements.
Order Types Change Real Risk
Regulatory investor education from the SEC is useful here because it forces precision. A stop price is not a guaranteed fill price. In fast markets your stop can execute well beyond where you intended. A market order gets you in, but perhaps at worse terms than expected. A limit order gives price control, but not certainty of execution. A stop-limit order avoids runaway slippage but can leave you standing on the platform watching the breakout train leave without you.
This means planned risk and realised risk are not the same thing. Good courses should say that out loud. A beautifully designed chart-pattern trade can still behave badly if the instrument is thin, the session is chaotic, or the order type is poorly matched to the setup.
Leverage Magnifies Bad Logic
FINRA’s guidance on margin accounts is a useful reminder that trade risk and account risk are not identical. A leveraged trader with several correlated positions can create account-level exposure far larger than any single pattern suggests. Margin calls and forced liquidation are not philosophical concerns. They are the practical consequence of taking structure-level logic and then ignoring portfolio-level reality.
The course default should therefore be conservative fixed-fraction sizing. Kelly-style frameworks are intellectually interesting and valuable in theory, but they are highly sensitive to edge estimation error. Since chart-pattern edges are noisy and conditional, full Kelly is an excellent way to learn humility at speed. Fractional Kelly, or simpler fixed-risk sizing, is usually more teachable and far more survivable.
What A Mature Pattern Trader Tracks
A mature trader tracks average win, average loss, gross and net expectancy, slippage, missed fills, and distribution of outcomes by setup type. If one pattern produces a strong theoretical hit rate but poor net results because execution is ugly, that matters. If another pattern wins less often but pays well when it wins, that matters too. You are not collecting chart patterns like trading cards. You are allocating risk to conditional structures under uncertainty.
Summary Takeaway
The quality of a chart-pattern trade is defined by invalidation, size, payoff, and net expectancy, not by visual neatness. If a setup cannot survive realistic sizing and realistic execution costs, it is not a real edge.
Course Navigation
Previous: Timeframes and Regime Filters: When Chart Patterns Matter Most
Next: Chart Pattern Evidence and Success Rates: What the Research Actually Says
Full course: Chart Patterns Course – Evidence, Execution, and Risk
This chapter is part of the Chart Patterns Course.