
Chart Patterns Course – Chapter 4 of 10. Continuation patterns are the part of technical analysis that most resembles a market taking a breath. The prior move happens fast, then price compresses, hesitates, and coils before deciding whether to continue. The mistake is assuming that every pause deserves the noble title of flag or pennant. Some pauses are just pauses. Continuation patterns only matter when trend, compression, and release all line up.
The Prior Move Matters More Than The Name
The strongest way to teach continuation patterns is to begin with the prior impulse. A flag after a sharp run higher is easier to interpret because it sits inside visible directional pressure. A similar-looking channel in a dull sideways market may just be local noise. This is one place where the broader literature on trend persistence helps more than the narrower literature on named shapes. AQR’s work on time-series momentum supports the idea that directional trends can persist. Continuation patterns are one visual expression of that broader phenomenon.
That is why this chapter treats the taxonomy as useful but secondary. Flags, pennants, triangles, and rectangles are descriptive labels. The more important question is whether the market is showing temporary balance inside a pre-existing move, followed by expansion in the same direction.
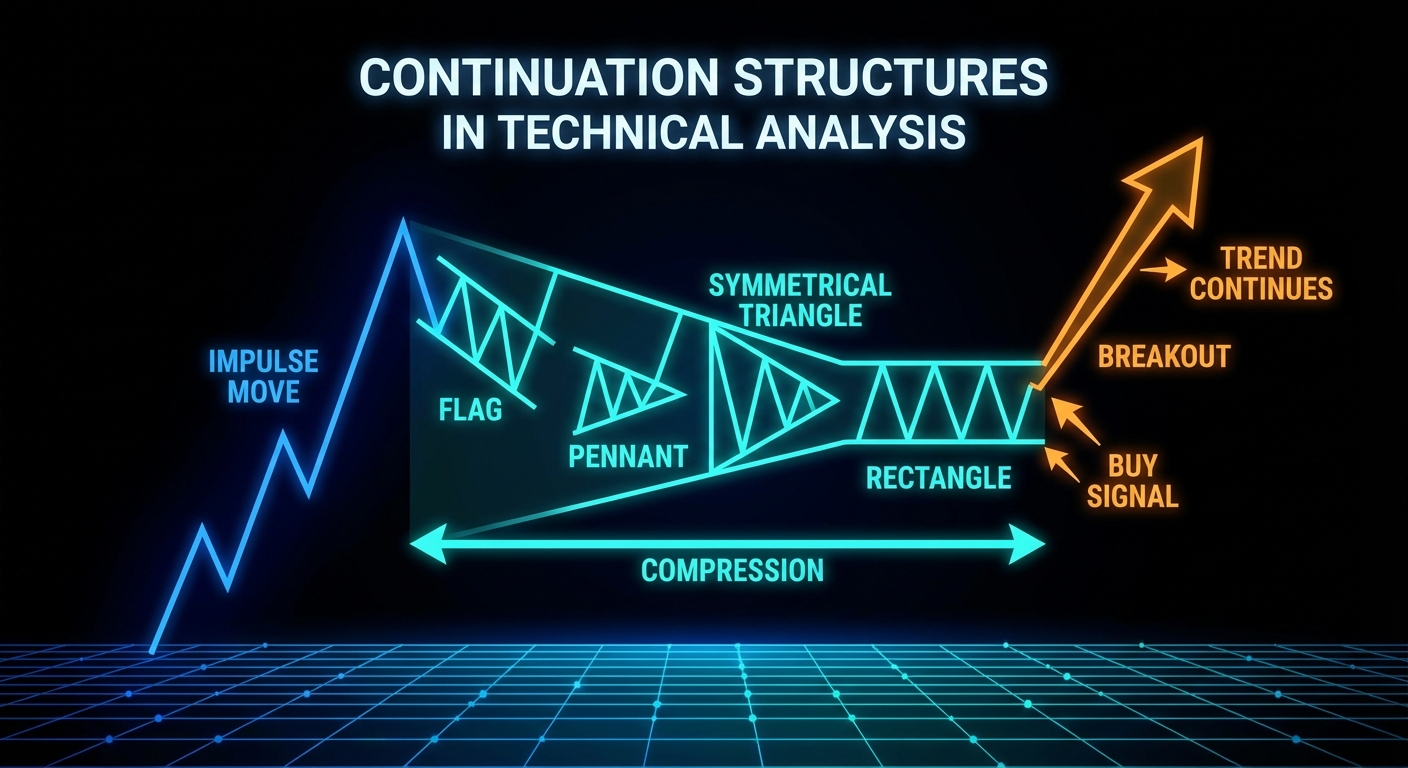
Flags And Pennants
Flags and pennants are short consolidations that follow a sharp directional advance or decline. The flag usually looks like a small countertrend channel. The pennant usually looks like a small converging structure. In both cases the logic is the same: the market moves aggressively, participants take profits, late entrants hesitate, volatility contracts, and then the market either resumes the move or fails the continuation attempt.
The educational trap is pretending the pattern is the edge by itself. In practice, the setup is strongest when the prior move was impulsive, the consolidation is relatively orderly, and the breakout occurs with clear acceptance. Flags built on thin liquidity, erratic candles, or a prior move that was never strong to begin with deserve much less respect.
Triangles And Pressure Asymmetry
Triangles are often taught as if ascending means bullish and descending means bearish. That is a useful bias, but not a law. A better explanation is pressure asymmetry. In an ascending triangle, lows rise into a relatively stable ceiling. Buyers are pressing higher whilst sellers defend a zone. In a descending triangle, highs compress lower into a relatively stable floor. That tells you something about pressure, but the trade still requires confirmation and context.
Symmetrical triangles are even more dangerous for overconfident traders because they are often neutral until the market chooses direction. The lesson here is simple: pressure is informative, but pressure is not completion. Completion occurs when the market exits the structure and shows that participants accept trade outside it.
Rectangles And Balance
Rectangles are probably the purest continuation pattern from an auction perspective. Price repeatedly rotates between two boundaries. Buyers reject the low. Sellers reject the high. The market is balanced. The continuation opportunity appears only when that balance breaks and trade is accepted outside the range. If price cannot hold outside the box, the market is telling you the balance remains unresolved.
Rectangles are also useful because they teach humility. A trader who is determined to predict the breakout direction before price confirms it is effectively guessing which side of the range will win. Sometimes that works. More often it is just impatience wearing conviction as a disguise.
Measured Moves Are Planning Tools
Continuation patterns often come with measured-move logic. The height of the rectangle, the length of the flagpole, or the depth of the triangle can be projected forward as an approximate target. Used properly, that is a planning tool. It helps estimate reward relative to the invalidation level. Used badly, it becomes a promise. No market is required to travel the textbook projection just because a chartist felt mathematically inspired.
# Continuation logic
if prior_trend_up and range_contracting and close > resistance:
    entry = close
    stop = pattern_low
    target = entry + measured_move
The code above is fine as a starting point, but it still needs context. Is the breakout into higher-timeframe resistance? Is participation improving? Is the market liquid enough? Does the measured move still produce acceptable reward after costs? The pattern gives you a framework, not absolution.
What The Evidence Supports
The cleanest evidence for this chapter is not “flags work at 68.3 percent.” That kind of number is usually marketing bait. The evidence is stronger at the level of trend persistence and conditional technical information. Lo, Mamaysky, and Wang support the broader idea that some technically defined structures can add information. Trend-following research supports the idea that directional persistence can exist across markets. Specific named continuation patterns are less firmly supported in the literature than textbook culture suggests.
That sounds disappointing until you realise it is actually useful. You do not need a mystical proof that pennants are special. You need a disciplined way to recognise compression inside trend and a sensible framework for trading the release if the market confirms it.
How Continuation Patterns Usually Fail
They fail when the prior trend was weak, when the consolidation is too chaotic, when the breakout occurs into obvious higher-timeframe opposition, or when traders enter on the assumption of continuation before the market confirms it. They also fail when the supposed continuation setup is actually a distribution or accumulation structure in disguise. Context saves you from a surprising amount of embarrassment.
A Practical Teaching Rule
If you are teaching or trading continuation patterns, use one simple rule: do not allow the pattern label to outrank the state of the market. A messy “bull flag” in a weak instrument is still a messy setup. A clean rectangle in a strong trending market with good participation is often more useful than a textbook pennant in a poor environment. That sounds almost too sensible to mention, which is probably why so much pattern education ignores it. Traders are drawn to named shapes because names feel precise. Markets care much more about pressure, liquidity, and follow-through.
Summary Takeaway
Continuation patterns are temporary balance structures inside an established move. Their usefulness comes from trend context, volatility compression, and confirmed expansion, not from the pattern name alone.
Course Navigation
Previous: Reversal Chart Patterns: Head and Shoulders, Double Tops, and Double Bottoms
Next: Breakouts and False Breakouts: Entries, Retests, and Failure Traps
Full course: Chart Patterns Course – Evidence, Execution, and Risk
This chapter is part of the Chart Patterns Course.