
Chart Patterns Course – Chapter 5 of 10. Breakouts are where chart patterns stop being theory and start becoming execution. This is also where traders get hurt. Retail education usually treats the breakout candle as the heroic final panel of the comic strip. In reality, breakouts succeed, fail, retest, trap, accelerate, and occasionally insult your intelligence in all five ways before lunch.
What A Breakout Actually Is
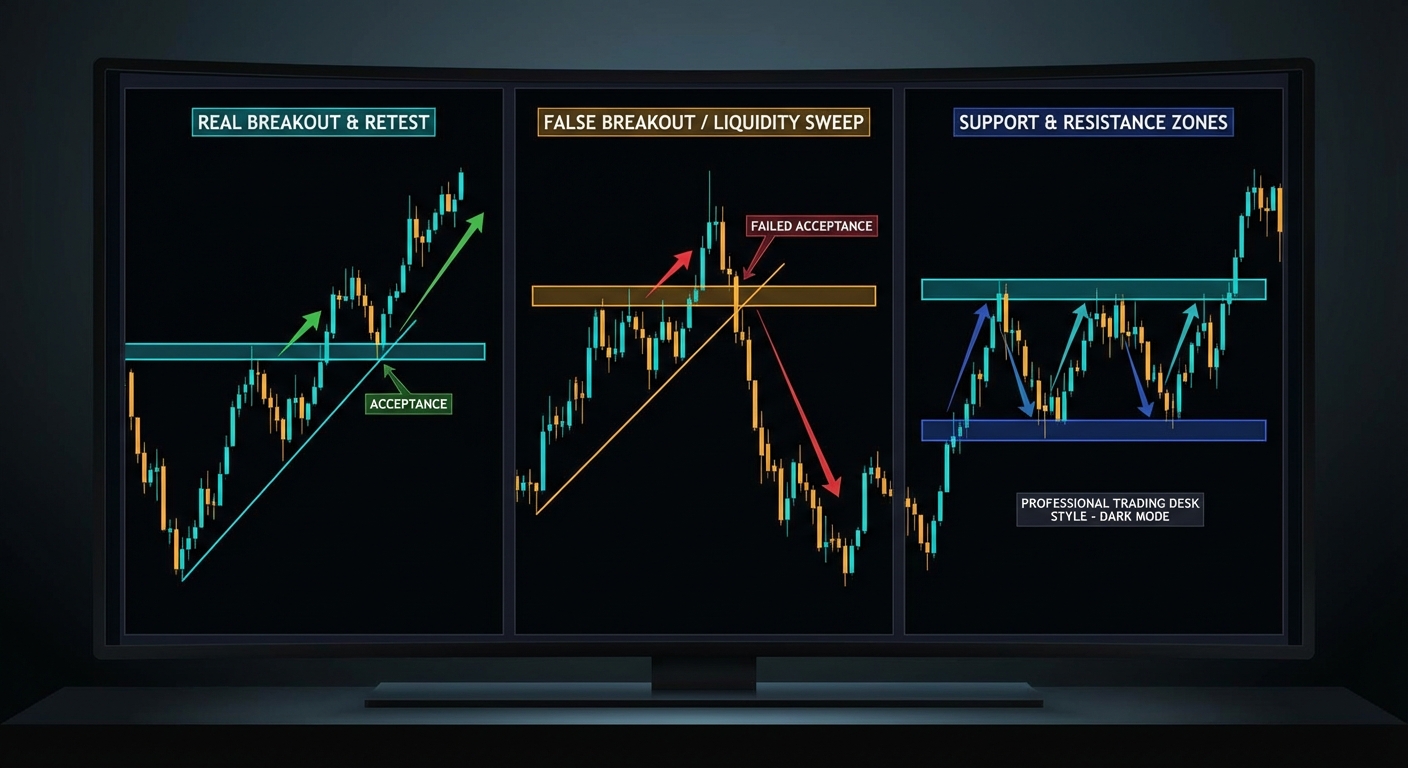
The best way to think about a breakout is not “price crossed a line.” A breakout is a move from rejection at a boundary to acceptance outside it. That distinction matters because many fake breakouts satisfy the lazy definition and fail the serious one. A wick through resistance followed by immediate collapse back into the range is not compelling acceptance. It is an attempted break that the market refused to keep.
This is where support and resistance research becomes useful again. Osler’s work suggests that trader-watched levels can genuinely matter. Her later research on order clustering goes further and explains why. Stop-loss orders, take-profit orders, and other resting interest accumulate around obvious levels. When price reaches them, the result can be interruption, acceleration, or a cascade. Breakouts are therefore not random decorations. They often emerge where market structure and clustered orders intersect.
Retests: Useful, Not Mandatory
Many traders are taught to wait for the retest. That advice is partly sensible and partly too rigid. A retest can improve trade location, tighten risk, and confirm that former resistance is now behaving like support, or vice versa. But not every clean breakout retests. Strong directional moves can simply go. If your rule says “no retest, no trade,” you will avoid some traps and miss some of the best momentum. That is a real trade-off, not a flaw in the universe.
The adult version of this lesson is to decide in advance which breakout style you trade. Immediate-break execution gives you better price and more false starts. Retest-based execution gives you more confirmation and more missed moves. Close-based confirmation reduces noise but often worsens price. There is no free lunch here. There is only consistency.
False Breakouts Are Usually Failed Auctions
A false breakout happens when price briefly escapes a range or level and then fails to hold there. Many traders explain this with dramatic stories about manipulation and stop hunting. Sometimes clustered liquidity is indeed part of the explanation. Osler’s research on stop-loss orders and price cascades supports the idea that breaks can be amplified by clustered orders. But it is still better to frame the event as failed acceptance than as a universal conspiracy theory. The market does not owe you a villain for every bad trade.
One practical benefit of this framing is that it suggests what to monitor. Did the breakout attract follow-through? Did price spend time outside the level or immediately snap back? Was participation supportive or absent? Did the move occur directly into a higher-timeframe opposing zone? Those questions tell you more than muttering “fakeout” after the fact.
# One breakout framework
if close > resistance and follow_through_present:
    take_long_breakout()
elif price_breaks_resistance and quickly_reenters_range:
    treat_as_failed_breakout()
What Makes A Breakout More Credible
Repeated pressure on the level helps. So does volatility contraction before the break. So does visible trend alignment. So does participation. So does clean higher-timeframe structure. None of these guarantees success, but together they create a more credible environment for the move. By contrast, a random lunchtime poke above resistance in a thin market with no prior pressure and no follow-through should be treated with suspicion, not with inspirational quotes about fortune favouring the bold.
Research on support and resistance from Chung and Bellotti adds a modern quantitative angle. Their work suggests that algorithmically identified levels can show statistically significant bounce behaviour, and that the number of prior touches matters. That makes intuitive sense. The more a level has functioned as a real boundary, the more meaningful it becomes when the market finally tries to leave it behind.
Why Execution Choices Change The Outcome
Suppose three traders all agree a breakout is happening. One buys the instant the level trades. One waits for the candle close. One waits for the retest. They are not trading the same strategy anymore. Their entry prices, stop placement, fill risk, and expectancy will differ. This is one of the easiest ways for pattern discussions to become misleading. People say “the breakout worked” when in fact one execution approach worked beautifully, another barely broke even, and the third never got filled.
This is why breakout education must include order logic, not just chart screenshots. A market order may guarantee participation but invite slippage. A limit order improves price if filled, but may miss the move. A stop-limit order reduces runaway fill risk, but can also leave you unfilled during the exact move you were trying to capture. Breakout trading lives at the intersection of chart structure and order mechanics.
Failed Breakouts Can Be Great Signals
One of the most useful professional habits is to treat failed breaks as information, not merely disappointment. If price cannot hold above a key resistance after apparently clean breakout conditions, that failure can reveal exhaustion and trapped participants. Failed upside breaks often reverse sharply because late buyers are now vulnerable and prior sellers regain confidence. The same logic works in reverse for downside failures.
Why Journaling Breakout Type Helps
One practical habit worth building is journaling the exact breakout style you took. Was it a first-touch break, a closing confirmation, or a retest entry? Did it occur from a mature range or a loose one? Was the move supported by participation or was it thin and suspicious? Over time, those distinctions teach you far more than a generic win-rate summary. Breakouts are not one setup. They are a family of related executions around a common structural event, and the quality differences inside that family matter a great deal.
Summary Takeaway
A breakout is a shift from rejection to acceptance outside a meaningful level. A false breakout is failed acceptance. The quality of the setup depends on pressure, context, participation, and execution choices, not just on whether price briefly crossed a line.
Course Navigation
Previous: Continuation Chart Patterns: Flags, Pennants, Triangles, and Rectangles
Next: Timeframes and Regime Filters: When Chart Patterns Matter Most
Full course: Chart Patterns Course – Evidence, Execution, and Risk
This chapter is part of the Chart Patterns Course.