
Ichimoku Trading Series: Part 3 of 10 | ← Previous | View Full Series
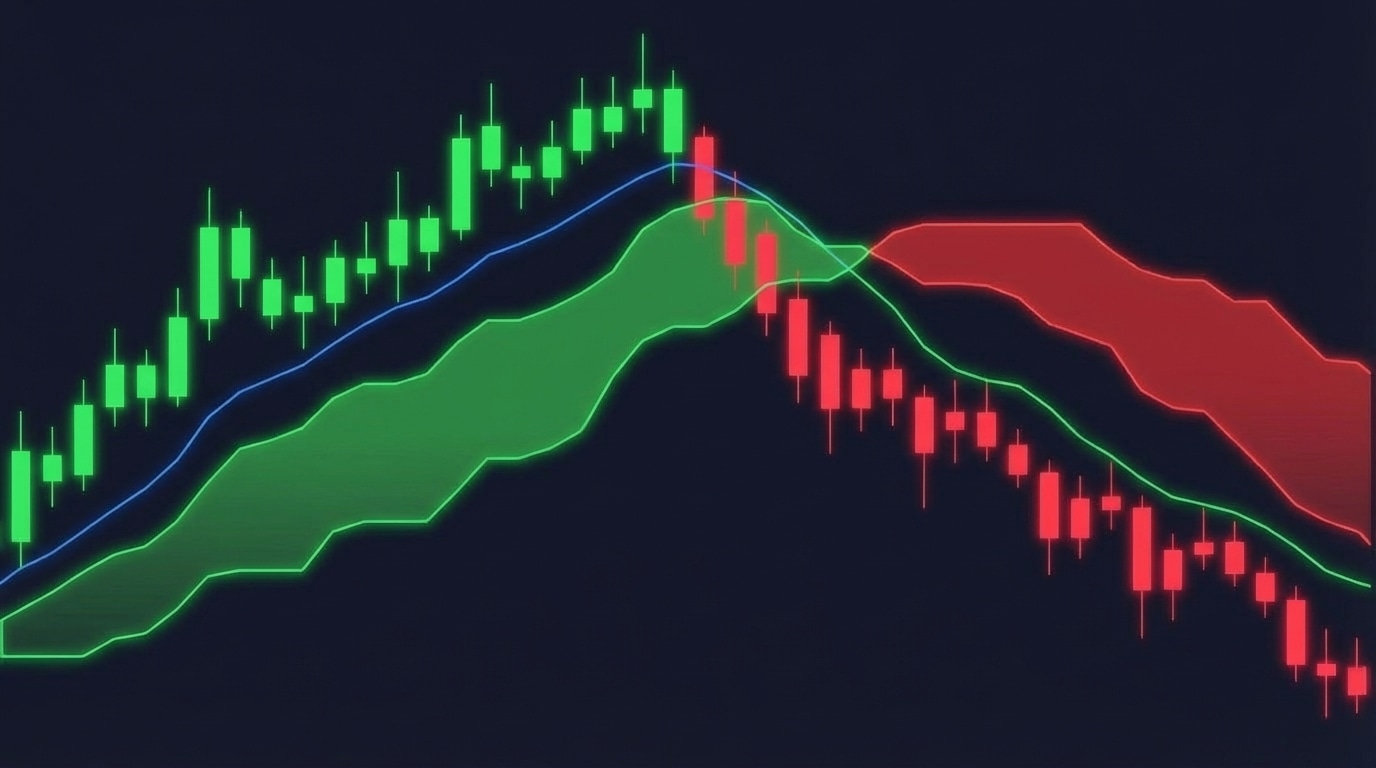
The Cloud (Kumo)
The space between Senkou Span A and Senkou Span B creates the “cloud” — a dynamic zone of support and resistance.
Bullish Cloud (Green)
When Span A > Span B, the cloud is bullish:
Price → [Span A (top)] → [Span B (bottom)]Bearish Cloud (Red)
When Span B > Span A, the cloud is bearish:
Price → [Span B (top)] → [Span A (bottom)]What the Cloud Tells Us
1. Trend Direction
- Price above cloud = Bullish trend
- Price below cloud = Bearish trend
- Price inside cloud = Consolidation/uncertainty
2. Support/Resistance Strength
- Thick cloud = Strong support/resistance
- Thin cloud = Weak support/resistance, easier breakouts
3. Future Sentiment
The cloud projects forward, showing where support/resistance WILL BE.
Critical: Avoiding Look-Ahead Bias
The Problem
Standard Ichimoku implementations shift Span A and Span B 26 periods into the future. In backtesting, this means your strategy “knows” future support/resistance levels — data leakage!
Our Solution
# We use UNshifted spans for signal logic
span_a_raw = (tenkan_line + kijun_line) / 2.0  # raw (no forward shift)
span_b_raw = (h.rolling(senkou_b).max() + l.rolling(senkou_b).min()) / 2.0  # raw
From the source material:
“I decided to compute the Ichimoku manually for one reason… The Ichimoku by default shifts or reads a bit in the future. This would be a look-ahead bias for our backtesting.”
Cloud Boundaries for Signals
cloud_top = df[["ich_spanA", "ich_spanB"]].max(axis=1)
cloud_bot = df[["ich_spanA", "ich_spanB"]].min(axis=1)
Cloud Twist
When the cloud changes color (Span A and Span B cross), it signals a potential trend reversal. This is called a Kumo Twist or Senkou Span Cross.
- Bullish Twist: Span A crosses above Span B → Cloud turns green
- Bearish Twist: Span A crosses below Span B → Cloud turns red