
Ichimoku Trading Series: Part 2 of 10 | ← Previous | View Full Series
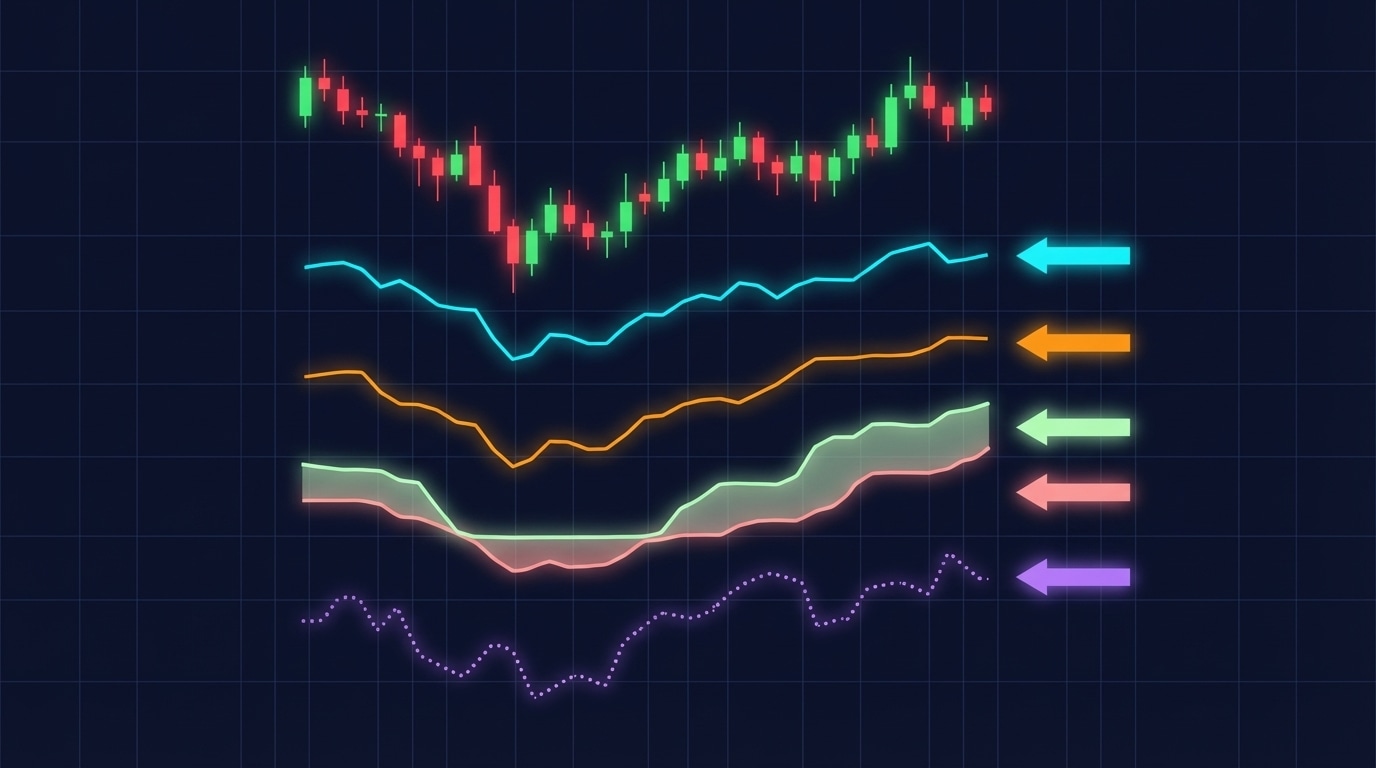
The Sacred Five Lines
Ichimoku Kinko Hyo (一目均衡表) translates to “one glance equilibrium chart” — a complete trading system visible at a glance.
1. Tenkan-sen (Conversion Line) — Period: 9
tenkan = (highest_high_9 + lowest_low_9) / 2The fastest-moving line, representing short-term momentum.
Trading Insight: When Tenkan crosses above Kijun, it is bullish. Below = bearish.
2. Kijun-sen (Base Line) — Period: 26
kijun = (highest_high_26 + lowest_low_26) / 2The medium-term equilibrium. Price tends to return to this line.
Trading Insight: Acts as dynamic support/resistance. A flat Kijun indicates consolidation.
3. Senkou Span A (Leading Span A)
span_a = (tenkan + kijun) / 2
# Traditionally plotted 26 periods ahead
The faster of the two cloud boundaries.
4. Senkou Span B (Leading Span B) — Period: 52
span_b = (highest_high_52 + lowest_low_52) / 2
# Traditionally plotted 26 periods ahead
The slower, more stable cloud boundary.
5. Chikou Span (Lagging Span)
chikou = close # Plotted 26 periods BEHINDCurrent price shown lagged for momentum confirmation.
The Parameters
| Component | Default Period | Our Setting |
|---|---|---|
| Tenkan | 9 | 9 |
| Kijun | 26 | 26 |
| Senkou B | 52 | 52 |
These are the original parameters developed for Japanese rice markets in the 1930s. They translate to roughly:
- 9 = 1.5 trading weeks
- 26 = 1 trading month
- 52 = 2 trading months
Code Implementation
# Ichimoku params (defaults)
TENKAN       = 9
KIJUN        = 26
SENKOU_B     = 52
How the Lines Interact
TK Cross (Tenkan/Kijun Cross)
- Bullish: Tenkan crosses ABOVE Kijun
- Bearish: Tenkan crosses BELOW Kijun
- Strongest: When cross happens above the cloud (bullish) or below (bearish)
Chikou Confirmation
- Bullish: Chikou is above price from 26 periods ago
- Bearish: Chikou is below price from 26 periods ago